Developing a Nutrient Management Plan for the Napa River Watershed
150 likes | 287 Vues
Developing a Nutrient Management Plan for the Napa River Watershed. Group Members Vinod Kella Rebecca Kwaan Luke Montague Linsey Shariq Peng Wang. Napa River Watershed. Watershed Characteristics - Runs 55 miles from Mt. St. Helena to San Pablo Bay

Developing a Nutrient Management Plan for the Napa River Watershed
E N D
Presentation Transcript
Developing a Nutrient Management Planfor the Napa River Watershed Group Members Vinod Kella Rebecca Kwaan Luke Montague Linsey Shariq Peng Wang
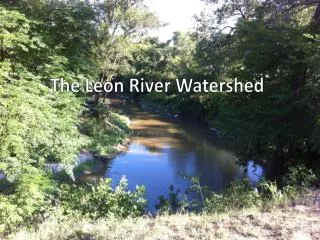
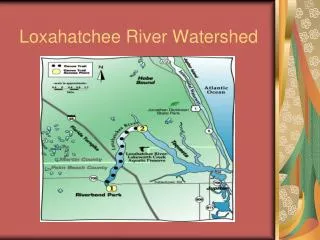
Napa River Watershed Watershed Characteristics - Runs 55 miles from Mt. St. Helena to San Pablo Bay - The area of watershed is 246 square miles - 47 tributaries - Mediterranean climate - Designated water uses: recreational and habitat - Provides habitat for Steelhead Trout and Chinook Salmon Napa River Watershed San Francisco Pacific Ocean
TMDL Process Clean Water Act - section 303(d) - Develop action plans (TMDL) for impaired waters Identify impairment Source assessment Linkage Analysis Develop numeric targets Load allocation Develop implementation plan
Napa River TMDL The Napa River watershed is listed as impaired by: -Nutrients -Sediments -Pathogens Excess nutrients cause eutrophication - Nitrate, Nitrite, Ammonia - Detrimental to habitat and recreational activites Anticipated Nutrient TMDL Submittal - December 31, 2005
Source Map Potential sources for nutrient loading are point and non-point sources such as: - Fertilizers runoff from agriculture land uses - Effluent from wastewater treatment plant - Seepage from septic systems - Livestock runoff - Other natural sources Legend Agriculture MainCities SepticTanks Streams
23 Sampling sites - TDN, TDP, Chlorophyll A - TDN – total dissolved nitrogen (nitrate, nitrite, ammonium) 3 Sampling events - January, June, Nov 2003 Target Values - Winter – 1 ppm TDN - Summer - 0.2 ppm TDN (Drinking water std – 10 ppm) Sampling Sites 1.41 ppm 1.23 ppm 2.1 ppm 1.58 ppm 2.41 ppm Legend 3.27 ppm * # Sample Sites Streams Main Cities 2.13 ppm January Hotspots June Hotspots
Computer Modeling Why use models? - Complex watershed processes can be simulated Compare nutrient loading processes from two models - SWAT and WARMF Calibrate models based on observed data - Ensure model simulations match local conditions - Gage Station - Water quality samples Simulate potential load reduction scenarios
SWAT SWAT (Soil and Water Assessment Tool) - BASINS promoted by the EPA (Better Assessment Science Integrating point and Nonpoint Sources) BASINS inputs - Land use, soil, streams, elevation - Subbasins created to pinpoint significant source locations SWAT Variables - Irrigation, fertilizer application, diversions, growing seasons
SWAT Calibration Match model hydrology with actual watershed flow data
WARMF WARMF (Watershed Analysis Risk Management Framework)
Best Management Practices (BMP) Agriculture • Expand riparian buffer zones • Fertilizer application management • Water runoff catchments Septic Systems - Nitrate-Reactive Media "NITREX filter“ - Recirculating Media Filter (RMF) - 30 to 70% nitrogen removal Waste Water Treatment Plants • Extend sewage systems’ sphere of influence • Lower nitrogen effluent levels
Future Work Finish calibration Run load reduction scenarios Estimate BMP cost effectiveness Develop nutrient reduction management plan
Acknowledgements Special thanks to: Peter Krottje of the San Francisco Bay RWQCB Project advisor Arturo Keller External advisors Patricia Holden and James Frew
![Souhegan River Watershed Management Plan Presentation for the [Watershed Community Group] [Date] by Minda Shaheen](https://cdn0.slideserve.com/97865/slide1-dt.jpg)