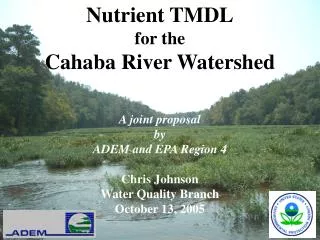
The Cahaba River Watershed Nutrient TMDL
320 likes | 577 Vues
The Cahaba River Watershed Nutrient TMDL. Presented by: Chris L. Johnson State of Alabama. 2006 National Monitoring Conference San Jose, CA. Agenda for Today. Characteristics of the Cahaba River Nutrient Impacts to the Cahaba River Summary of the Cahaba Nutrient TMDL

The Cahaba River Watershed Nutrient TMDL
E N D
Presentation Transcript
The Cahaba River Watershed Nutrient TMDL Presented by: Chris L. Johnson State of Alabama 2006 National Monitoring Conference San Jose, CA
Agenda for Today • Characteristics of the Cahaba River • Nutrient Impacts to the Cahaba River • Summary of the Cahaba Nutrient TMDL • Nutrient target development • Application of the target to Cahaba River • TMDL results and NPDES permit requirements • TMDL implementation strategy • Current Status of Cahaba TMDL • Ongoing Initiatives
Drainage Area – 397 mi2 • Land Use/Cover – 50% forested, 37% urban, 7% agriculture • Ridge & Valley Region • Sandstone Ridges w/ limestone, dolomite/shale • Naturally low nutrient levels • Multiple Uses – water supply, swimming, fishing, recreation • Hydrology - Flashy • Lots of points sources • 12 majors • 19 minors
What are the Nutrient Impacts? • Tip for the Day! - Documenting high TP & TN Levels is not sufficient in/of itself!! • Cahaba River • Aquatic life use is impaired by excessive nutrients: • Nuisance algal blooms (excess periphyton growth) • Dissolved oxygen violations • Huge daily swings in dissolved oxygen • Undesirable shifts in the native species of plants and animals • Loss of Habitat
Shelby Co Highway 52 (S2) • Downstream of Buck Creek • Still highly entrenched • Canopy present • §303(d)-listed for nutrients, siltation, pathogens, and other habitat alteration
Bibb Co Highway 24 (S1) • Downstream of Shades Creek • Wide and flat • No canopy
Nutrient Impacts-When and Where do These Impacts Occur? • Downstream of “food” sources • WWTPs • Urban runoff • During periods of low flow, low velocity, and high temperature. • Areas where the river is wide, water is shallow, tree canopy is open and light is readily available.
Why do we need nutrient targets? • Numeric Nutrient Criteria for Rivers & Streams Not Currently Established • Need Quantifiable Endpoints to Evaluate Condition of Waterbody in Regards to Meeting its Designated Use(s) • Necessary for TMDL Development
Key Aspects of Nutrient Target Development for Cahaba River • Consistent with EPA Guidance & Recommendations • Uses a Reference Condition Approach • Scientifically Defensible • Uses Total Phosphorus (TP) as the Controlling Nutrient • Fully Supports Designated Uses • Long-Term Monitoring Plan is Essential
Nutrient Target Cont’d • ADEM and EPA Region 4 have collected, compiled & reviewed extensive resources to determine the nutrient target. • Multiple agencies have collected data within the Cahaba River Watershed. • Chemical, physical and biological data and information. • EPA Region 4 Conclusion: • Recommended range of 20 to 40g/L total phosphorus should prevent filamentous algae growth and be protective of designated uses.
ADEM Nutrient Target Approach for the Cahaba River • Select Set of Least-Impacted Reference Streams. • ADEM reference stations with sufficient data, • Same Level III Ecoregion (Ridge & Valley) • Mixed land use, • Low levels of measured periphyton, and • Healthy habitat, macroinvertebrates, and fish communities • Calculate the 75th percentile of growing season data. • For Ecoregion 67, Target = 35 µg/L TP
Ecoregion Reference Site Data 35 mg/L Target
Weaknesses with Current Approach • Very Conservative!!! • Not an “effects-based” target • Reference watersheds are not on the same scale. • Uncertainty remains • Cause and effect relationships are a mystery!! • How much algae is too much?
Nutrient Target Application • Interpretation of target is key to ensure protection of the designated uses of the Cahaba River • Spatial = 3 locations chosen to monitor instream conditions. • Roper Road (St. Clair County Road 10) • Bain’s Bridge (Old Montgomery Highway) • Shelby County Highway 52 • Temporal = Growing season median (multiple years) should not exceed TP target at these predetermined evaluation points • Growing season is defined as April-October • Study period evaluated: 1999-2001 growing seasons
TP Target (35 g/l) Application of Target to Cahaba River:1999-2000 TP Concentrations m
Instream Evaluation Points • Downstream of point sources and urban areas • Upstream of known/potential periphyton “hot spots” • Meeting a 35 µg/L target (GSM) at these 3 points mitigates nutrient impacts throughout Cahaba system.
m TP Target (35 g/l) Instream Evaluation Points Evaluation Points
TMDL Implementation Strategy • Phase 1: NPDES permit revisions required by 2010 (based on assumed TMDL Approval date of 2005) • Majors (>1.0 MGD)-monthly avg. limit not to exceed TP = 0.4 mg/L • Minors (<1.0 MGD)-monthly avg. limit not to exceed TP = 2.0 mg/L • Phase 2: NPDES permit revisions required by 2015 • Major (>1.0 MGD)-monthly avg. limit not to exceed TP = 0.2 mg/L • Minors (<1.0 MGD)-monthly avg. limit not to exceed TP = 0.5 mg/L • Urban areas achieve 25% reduction in TP (1999-01’ baseline) • Phase 3: NPDES permit revisions required by 2020 • Major (>1.0 MGD) monthly avg. limit not to exceed TP = 0.043 mg/L • Minors (<1.0 MGD)-monthly avg. limit not to exceed TP = 0.3 mg/L • Urban areas achieve 65% reduction in TP (1999-01’ baseline) • Cahaba River meets instream target of 35 µg/L at evaluation points
Implementation Strategy to Reduce Total Phosphorus Loads • Reducing WWTP loads: • NPDES permits for reduced effluent TP concentrations • Reducing MS4/urban loads: • NPDES MS4 permittees are expected to meet a 65% reduction using a BMP approach. • Reducing nonpoint source loads: • Clean Water Partnership and Upper Cahaba Watershed Consortium • Land use planning considerations for watershed protection
TMDL Implementation Strategyfor NPDES Permits • Permit compliance schedule: • will be reviewed on an individual facility basis; • must achieve the WLA “as soon as possible”; • will establish interim targets on a case-specific basis; and • will be re-evaluated every permit cycle based on available data and information. • However, the compliance schedule cannot continue indefinitely; other options (e.g., variance) may be necessary down the road. • Permitting Mechanism: • “Watershed Permit” for TP for Cahaba point sources similar to Neuse River permit for nitrogen is being considered.
Current Status of Cahaba River TMDL • Comment period closed January 2005. • Wrapping up response to public comments. • Minor revisions to the TMDL Report are underway. • Expected to submit to EPA for approval very soon!!!