Download

1 / 21
210 likes | 349 Vues
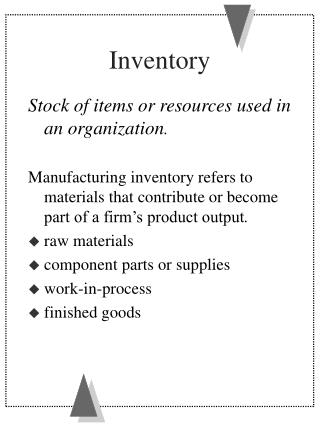
INVENTORY. Inventory is the stock of any item or resource used in an organization and can include: raw materials, finished products, component parts, supplies-in-transit and work-in-process.

E N D
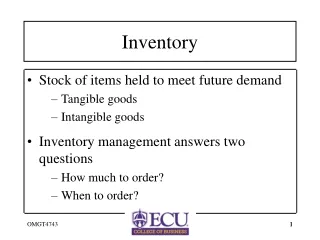
INVENTORY • Inventory is the stock of any item or resource used in an organization and can include: raw materials, finished products, component parts, supplies-in-transit and work-in-process. • An inventory system is the set of policies and controls that monitor levels of inventory and determines what levels should be maintained, when stock should be replenished, and how large orders should be
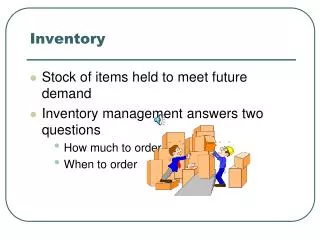
WHY INVENTORY 1. To maintain independence of operations 2. To meet variation in product demand, production rate and lead time 3. To allow flexibility in production scheduling 4. To provide a safeguard for variation in raw material delivery time 5. To take advantage of economic purchase-order size 6. Disruptions
POSITIVE ASPECTS • Decouple operations • Avoid disruptions • Reduces no of ordering / set up • Hedge against inflation • Meet unexpected demands • Quantity discounts
NEGATIVE ASPECTS • Quality of product service bundle • Hide operational problems • High cost • Obsolescence • Damage during storage • Cost of tracking • New product / technology introduction
Independent Demand (Demand for the final end-product or demand not related to other items) Dependent Demand (Derived demand items for component parts, subassemblies, raw materials, etc) Independent vs. Dependent Demand Finished product E(1) Component parts
Inventory Systems • Single-Period Inventory Model • One time purchasing decision (Example: vendor selling t-shirts at a football game) • Seeks to balance the costs of inventory overstock and under stock • Multi-Period Inventory Models • Fixed-Order Quantity Models • Event triggered (Example: running out of stock) • Fixed-Time Period Models • Time triggered (Example: Monthly sales call by sales representative)
INVENTORY CONTROL SYSTEM • When to order • How much to order • Buffer Stock • Maximum Inventory • How often to review stock
COSTS • Holding (or carrying) costs • Costs for storage, handling, insurance, etc • Setup (or production change) costs • Costs for arranging specific equipment setups, etc • Ordering costs • Costs of someone placing an order, transportation etc • Shortage costs
Single Period Model Example • Our college basketball team is playing in a tournament game this weekend. Based on our past experience we sell on average 2,400 shirts with a standard deviation of 350. We make Rs100 on every shirt we sell at the game, but lose Rs50 on every shirt not sold. How many shirts should we make for the game? Cu = Rs100 and Co= Rs50; P≤ 100 / (100 + 50) = .667 Z.667 = .432 (use NORMSINV(.667)) therefore we need 2,400 + .432(350) = 2,551 shirts
Fixed-Order Quantity Model Assumptions • Demand for the product is constant and uniform throughout the period • Lead time (time from ordering to receipt) is constant • Price per unit of product is constant • Instantaneous replacement
Fixed-Order Quantity Model Assumptions • Inventory holding cost is based on average inventory • Ordering or setup costs are constant • All demands for the product will be satisfied (No back orders are allowed)
TotalCost Annual Cost of Items (DC) QOPT Cost Minimization C O S T Holding Costs Ordering Costs Order Quantity (Q)
TOTAL COST Total Annual = Cost Annual Purchase Cost Annual Ordering Cost Annual Holding Cost + +
Price-Break Example Problem A company has a chance to reduce their costs by placing larger quantity orders using the price-break order quantity schedule below. What should their optimal order quantity be if this company purchases this single inventory item with an ordering cost of Rs4, a carrying cost rate of 2% of the inventory cost of the item, and an annual demand of 10,000 units? Order Quantity(units)Price/unit(Rs) 0 to 2,499 Rs1.20 2,500 to 3,999 1.00 4,000 or more .98