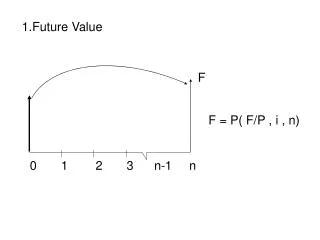
Maximizing Stock Value through Future Value Estimation
Learn the importance of current and future stock value connection to avoid overpaying. Master stock valuation methods & P/E ratios to make informed investment decisions. Discover strategies on projecting future EPS growth and setting realistic P/E ratios for optimal returns.

Maximizing Stock Value through Future Value Estimation
E N D
Presentation Transcript
Part I Linking Future Value with Current Value By Kevin Gillogly HDIC Education Segment March 14, 2005 www.bivio.com/hdic
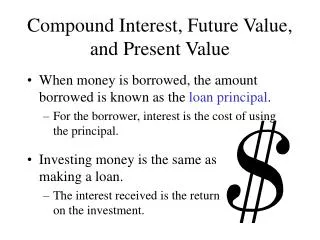
Reasons Most People Fail in the Stock Market • They Invest in Companies They Don’t Understand • They Don’t Know How to Value a Stock • They Pay Too Much www.bivio.com/hdic
Linking Current Value & Future Value • Current Value is _______? • Future Value is based on ________? • Knowing these two terms is a simple, yet effective way, to protect yourself from overpaying for a stock • Value of Classic’s Stock Wizard • Use red alerts to guide you www.bivio.com/hdic
Stock Valuation Is a method of directly connecting the stock price to the company’s profits (EPS), and is expressed as a ratio of price to EPS. • P/E Ratio = Stock Price / EPS • Wall Street’s way of measuring the value of the growth of the company www.bivio.com/hdic
Price Follows Earnings WAG The price need not grow at the same rate as the earnings. When EPS advances the price will almost always advance. www.bivio.com/hdic
Section 3 for Walgreens EPS growth has been around 17%. Which of the high P/E’s are reasonable? Which of the low P/E’s are reasonable? www.bivio.com/hdic
“Companies … with long records of above average growth tend to sell at higher P/Es, but their highs are usually not sustainable.” -- Handbook, 130 www.bivio.com/hdic
Stages of Growth First things first. What type of growth is this company? Use the SSG graph to help determine (but use your judgment too) … • A fast growth company? • > 20%, looks like peaks of a MT • A stalwart growth company? • > 10 & < 15%, looks like foothills of MTS • A slow growth company? • < 7%, looks like topographical map of DE • A cyclical company? • Erratic growth, looks like the polygraph of a liar www.bivio.com/hdic
Stages of Growth Large dividends (Payout ratio >40%) No dividends Small dividends (Payout ratio <20%) www.bivio.com/hdic
Where do sales come from? Sales are the dollars that flow into the company. It is what drives the growth of the company. It can come from: • Selling more of a product or service • Making it better • New uses for it • Increasing demand for it • Charging more for the product or service; • Increasing market share • Make it better/New uses/Increase demand • Acquiring competitors • Acquire unrelated businesses www.bivio.com/hdic
Where do earnings come from? Earnings is what remains after expenses and taxes. It can go to: • the owners (dividends) • pay off debt (loans, bonds) • be used to grow the company (equity) • Improve company operations • Acquire new companies www.bivio.com/hdic
“Buy the rights stocks at the wrong price at the wrong time and you’ll suffer great losses.” Peter Lynch, One Up On Wall Street, Pg. 72. www.bivio.com/hdic
Applying Judgment • Be reasonably conservative • But not everywhere in the SSG • And not all the time • Remember our goal is purchase stocks not hoard cash • Be more aggressive on your future EPS growth (Sec. 1-4) • Save your conservatism for your future P/Es (Sec. 4A and 4B) • Link 1-4 with 4A www.bivio.com/hdic
More Stock Valuation Another method of stock valuation: • PE/G Ratio = PE Ratio / Future EPS Growth Rate • Wall Street’s way of measuring the value of the earnings of the company www.bivio.com/hdic
Using the PE/G Ratio • P/E ratio divided earnings growth • PE/G ratio of 1 = fairly valued; • PE/G ratio of 2 = overvalued; • PE/G ratio 1.5 = upper limit of fairly valued • PE/G ratio under 1 = on sale • WAG has a PEG ratio of 1.75 • Current P/E of 29.6 divided by historic earnings growth of 16.9 • How is WAG valued? • What would be a fair future high P/E value for WAG based on 16.9% EPS growth? Answer: 25.4 www.bivio.com/hdic
Linking Current Value & Future Value • Forecasting a high P/E (4A) no higher than 1.5 times (150%) of your future EPS growth on the front of the SSG (1-4) allows for the P/E to expand towards 200%. • Expanding P/Es is how to make money. • Conversely, a P/E that shrinks (or contracts) is a sure fire way to lose money. www.bivio.com/hdic
Using PE/G Ratio, Pt. 3 A high P/E of 46.2 / 15% future EPS growth = a PE/G ratio 3.08. To make $107.72 in 5 years time WAG would have to become severely overvalued. Is this realistic? www.bivio.com/hdic
Linking Current Value & Future Value • This allows us to test the reasonableness of our estimated EPS growth vs. our estimated PEratios • Sect. 4A ties high P/Es in Sect. 3with our future earnings growth in Sect. 1-4 www.bivio.com/hdic
Projected P/E for WAG www.bivio.com/hdic
Setting Up Projected P/Es www.bivio.com/hdic
Projected P/E for WAG This gives us another way to value P/Es. To learn more: Classic Manual, pg. 98 www.bivio.com/hdic
Another Way to Determine Future Value • Add future P/Es along with future EPS growth • WAG has a projected P/E of 25.6 divided by future earnings growth of 15.0 for a PEG ratio of 1.71 • How does this change WAG’s valued? Answer: No matter which metric we use WAG is overvalued using the SSG. This is not surprising for a well managed company with consistent EPS growth. www.bivio.com/hdic
Conclusion • Look at the graph is it steady and growing? • Compare EPS growth with Divided Payout Ratio (Sec. 3-G-7) • Are dividends growing faster than EPS? • That would be “pink” flag • Link future value (Sec. 1-4) with the current value (Sec. 3-9) • Reasonableness (of this link) is found in Sec. 4-A (future high PE) • Limit 4-A (future high PE) to no more than 150% of 1-4 (future EPS) • Test the reasonableness of your judgments www.bivio.com/hdic
Questions www.bivio.com/hdic