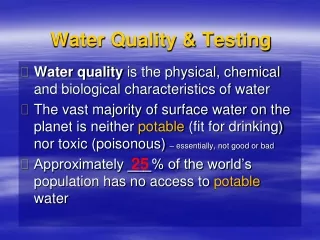
Water Quality Testing
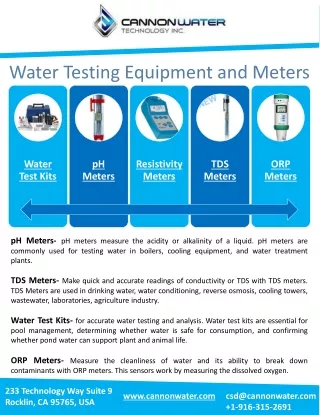
Water Quality Testing. Temperature. Why record temperature of water?: Different species of fish thrive in different water temperatures. A safe temperature range for many fish is 24-28 degrees Celsius. Observe temperature in Celsius and Fahrenheit. Record temperature in data log. pH.

Water Quality Testing
E N D
Presentation Transcript
Temperature • Why record temperature of water?: Different species of fish thrive in different water temperatures. A safe temperature range for many fish is 24-28 degrees Celsius. • Observe temperature in Celsius and Fahrenheit. • Record temperature in data log
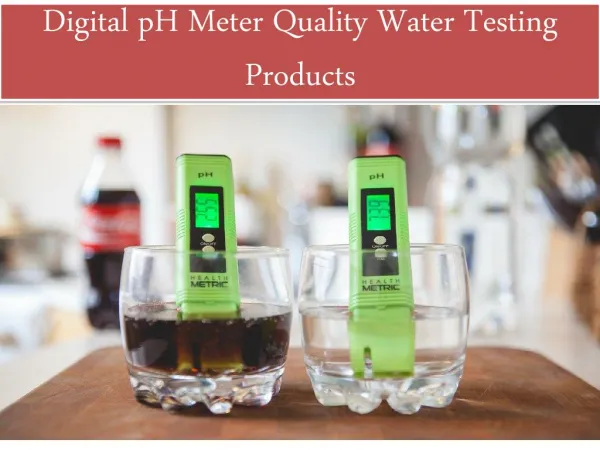
pH • Why test pH?: Measures acidity of water. 7.0 is neutral. >7 is alkaline (basic), <7 acidic. • Fill test tube with 5 ml of water (to the line) • Add 3 drops of Indicator Solution • Cap test tube and invert to mix solution • Match color of solution to pH color chart • Record pH in data log.
Why test for ammonia?: Animals release ammonia through their waste. High levels prevent fish from respiring properly. Biological filtration helps keep levels in check. Fill test tube with 5 ml of water. Add 8 drops from Ammonia Test Solution Bottle (ATSB) #1. Add 8 drops from ATSB #2. Cap test tube and shake for 5 seconds. Wait 5 minutes for color to develop. Match test solution to Ammonia color chart. Record ammonia level in data log. Ammonia Test
Nitrite Test • Why test for nitrite?: Nitrite (NO2-) is made by biological filter. Beneficial bacteria convert ammonia to nitrite. Nitrite affects fish respiration and immune system. • Fill test tube with 5 ml of water • Add 5 drops of Nitrite Test Solution • Cap test tube and shake for 5 seconds • Wait 5 minutes for color change • Match color of solution to Nitrite color chart • Record nitrite level in data log.
Nitrate Test • Why test for nitrate?: Nitrate (NO3-) is produced by biological filter. Another species of bacteria convert nitrite to nitrate. High nitrate levels contribute to fish disease. Plants are able to absorb nitrates for tissue growth. • Fill test tube with 5 ml of water • Add 10 drops from Nitrate Test Solution Bottle #1 (NTSB) • Cap test tube and invert several times to mix solution • Vigorously shake NTSB #2 for 35 seconds. • Add 10 drops from NTSB #2 to water sample • Cap test tube and shake vigorously for one minute. • Wait 5 minutes for color to develop • Match color of solution to Nitrate color chart. • Record nitrate level in data log.
Nitrogen Cycle adayinthelifeofamutt.blogspot.com
Additional Notes • Parts per million (ppm) = mg/L • Rinse test tube with clean water after each use. • Wear gloves and goggles • We will be using the iPad to input/log water quality data. • Water chemistry data will be collected by period 6
Water Chemistry Data Collection Schedule • 4/10 (Stations 1 and 2) • 4/11 (Stations 3 and 4) • 4/16 (Stations 5 and 6) • 4/19 (Stations 7 and 8) • 4/24 (Stations 1 and 2) • 4/27 (Stations 3 and 4) • 4/30 (Stations 5 and 6) • 5/3 (Stations 7 and 8)