Download
1 / 21
220 likes | 662 Vues
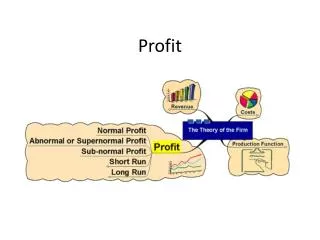
Economic Profit. When the term profit is used in economics it is usually a short way of saying economic profit. Let’s see what this means. Example.

E N D
Economic Profit When the term profit is used in economics it is usually a short way of saying economic profit. Let’s see what this means.
Example Say I am planning to open my own entertainment establishment, called Parker’s Pool Hall. I will have explicit costs for the pool tables, pinball machines, labor and electric I use. Say these explicit costs add up to $10,000 a year. If the revenue to the firm is $60,000 a year, the accounting profit (revenue – explicit costs) is $50,000. How do you think I would feel if I gave up a job where I made $40,000 a year and I could have rented out the building where the pool hall is located for $15,000?
Implicit costs Notice the $60,000 in revenue pays the explicit costs of $10,000, pays me the $40,000 I gave up in a job, and only pays $10,000 of the $15,000 in forgone rent. I end up short $5,000 (I always end up short – slow too!) in the entertainment business, compared to what I was doing before. The forgone income and rent are examples of implicit costs that economists (and others do too!) incorporate into the analysis of profit.
Profit Economic profit = accounting profit – implicit costs = total revenue – explicit costs – implicit costs = total revenue – total costs = profit. Costs mean all explicit and implicit costs and in economics the term cost really means opportunity cost, or what is given up in a course of action.
Now, we have mentioned accounting profit and economic profit. Again, Economic profit = accounting profit – implicit costs. When you look at my example, the implicit costs were my salary that I had to give up to run the business and the rent I would have gotten had I rented the building out. These implicit costs were what I would have normally been paid had I not started this business. In this sense the implicit costs have been called normal profit. They are the normal profit I would have made. So, we have three profit ideas. If the context is not spelled out we mean economic profit when the term profit is used.
Perfect Competition in the LONG RUN
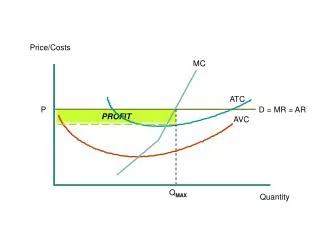
Useful diagram P D1 S1 ATC1 MC1 P1 P=MR1 Q q Q1 q1 Market Firm
Produce the q where MR = MC and see what type of profit exists by looking at (P - ATC) times Q or TR-TC at the q mentioned. Profit = TR - TC but this is hidden by the laws of algebra. PQ = TRATC times Q = (TC/Q) times Q = TC (P-ATC) times Q = PQ - (ATC times Q) = TR - TC
Notes about diagram Market In the market the price is determined by the interaction of supply and demand. When you think about the supply curve, there are a certain number of firms involved. You can think of this as being the short run where the amount of capital is fixed for each seller. In the short run, then, no new firms can enter either because they can’t get more capital either.
Notes about diagram Firm The firm will produce where MR = MC and have profit = (P - ATC)Q = 0.
increase demand On the next screen you will see demand increase in the market. Imagine consumers demand more. Then, 1) The price in the market will increase to P2, 2) The MR(price) for the firm will rise to MR2, 3) The output of the firm will expand to q2, 4) The firm will have profit given by the shaded rectangle.
increase demand P D2 D1 S1 ATC1 MC1 P2 P2 = MR2 P1 P1=MR1 Q q Q1 q1 q2 Market Firm
demand increase In the short run when the demand increases, existing firms find it worthwhile to produce more, but they can not expand the production facility, by definition, and other firms can not enter the industry. The profit that exists in the short run are enjoyed by the firms in the industry. But in the long run other firms can enter the industry, as well as have existing firms expand their production facility. In the long run we want to note 1) what impact profit has on firms and 2) what happens to input prices.
profit impact In the long run positive economic profit attracts firms to the industry. Firms will enter the industry until profit is driven to zero. The presence of economic losses(negative profits) forces some firms to leave the market. Firms will exit until the profit is zero.
input prices By definition in economics, resources are scarce. In the context of increasing demand for output we want to think about what might happen to the price of inputs. We identify three cases. 1) Inputs are relatively abundant and thus there is no increase in input prices as the demand for inputs increases. This is called a constant cost industry. 2) Inputs are in relative short supply and thus there is an increase in input prices as the demand for inputs increases. This is called an increasing cost industry. 3) Inputs can be used in new ways and thus there is a decrease in input prices. This is called a decreasing cost industry.
ideas to come Now, if a firm has positive economic profit we will see 1) firms enter the market and thus market price falls, and 2) As the price falls profit will be driven back toward 0. This will have an impact on how much the supply curve shifts.
no change in input prices P D2 D1 S1 ATC1 MC1 S2 P2 P2 = MR2 P1 P1=MR1 Q q Q1 Q2 q1 q2 Market Firm
no change in input prices Since there is no change in input prices in this example profit will again be zero when the supply shifts out as far as the new demand to return the price to P1. Supply S1 had a certain amount of firms involved and then some more firms entered(when profit was positive) to give us a certain amount of firms involved with S2. So there really is a separate supply curve for each specific number of firms in the industry. So in the long run we have variation in the number of firms in the industry, depending on the level of demand.
Long run supply curve The long run supply curve in the market shows us the price and quantity combinations where 1) the number of firms adjusts, and 2) profit is zero. On the slide two screens ago we see the same price, P1, but two levels of output, Q1 and Q2. Since input prices didn’t change, P1 will always be the price that results in zero profit. On the following screen you will see the long run supply curve in the market in this constant cost case.
no change in input prices P D2 D1 S1 ATC1 MC1 S2 P2 P2 = MR2 P1 P1=MR1 Q q Q1 Q2 q1 q2 Market long run supply Firm
Note I have not shown in this section a graph of a firm having a loss, but you can do this yourself. Have demand fall and see the market price fall. Then the firm will have a loss and want to exit the industry.