Understanding Economic Concepts: Production, Costs, and Market Structures
This text explores key economic concepts including production and costs, elasticity of demand and supply, and market structures. Chapters 12-14 delve into the intricacies of total and marginal costs, economic rent, and price ceilings/floors. Learn about the characteristics of perfect competition, monopoly, and oligopoly, as well as the principles governing marginal product and average costs. Understand the impacts of elasticity on consumer behavior and market equilibrium, while examining the effects of supply-and-demand shifts on pricing and production outcomes.

Understanding Economic Concepts: Production, Costs, and Market Structures
E N D
Presentation Transcript
Production and costsChapters 12 -14ElasticitySupply & DemandPPFMRPEconomic RentPrice Ceiling/FloorTotal utility/ marginal utility
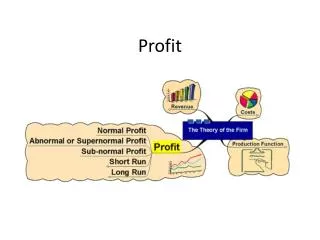
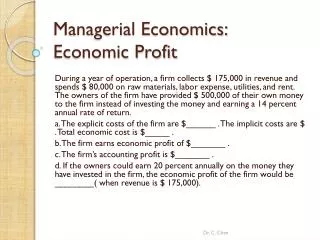
economic profit = total revenue - total costs = (price)(quantity) - (explicit + implicit costs)
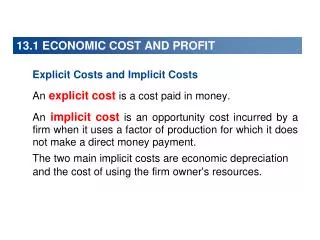
implicit costs • includes normal profit • so zero economic profit • still a normal profit
Short Run vs. Long Run • Short Run (SR) • plants, equipment fixed • labor inputs variable • Long Run (LR) • time frame where all inputs are variable
marginal product (MP) • change in TP due to one more worker • law of decreasing returns
Average Product (AP) TP = labor
1 2 3 2 1 0 -1 AP # workers TP MP 0 1 2 3 4 5 6 7 0 1 3 6 8 9 9 8 1 1.5 2 2 1.8 1.5 1.1
Total Cost (TC) • total fixed cost (TFC) • does not change in SR • total variable cost (TVC) • cost of labor • TC = TFC + TVC
Marginal Cost • change in TC due to one-unit increase in output (Q)
Average Cost (ATC) • = TC/Q • average fixed cost (AFC) = (TFC/Q) • average variable cost (AVC) = (TVC/Q) • ATC = AFC + AVC
Economies of scale • increase inputs 10% • output increase > 10% • ATC falls • natural monopoly
Diseconomies of scale • increase inputs 10% • output increase < 10% • ATC rises
Chapters 12-14 • characteristics of • perfect competition • monopoly • monopolistic competition • oligopoly • in your lecture notes!
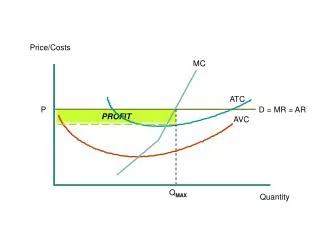
all firms • maximize profit • MR = MC • if P > ATC • economic profit • if P < ATC • economic loss
perfect comp. & monopolistic comp • both • many firms • easy entry/exit • LR normal profit • differ • identical vs. differentiated product • demand curve
perfect comp & monopoly • monopoly price higher • monopoly quantity lower • inefficient
P, MR MC Pm Pc D MR Q Qm Qc Pm > Pc Qm < Qc
consumer surplus P, MR MC Pm deadweight loss D MR Q producer surplus Qm monopoly
monopoly & monop. comp. • both • downward sloping demand curve • differ • # firms • barriers to entry
monopoly & oligopoly • both • barriers to entry • downward sloping demand curve • differ • # of firms
Elasticity • price elasticity • demand • supply • cross elasticity • income elasticity
what is it? • % change quantity • divided by % change in -- price of same good OR -- price of related good OR -- income
elasticity of demand % change in Qd % change in P
< 1 • inelastic • % change Qd < % change P • Qd not sensitive to change in P • TR rises and P increases
perfectly elastic demand • horizontal demand curve • any increase in price • Qd falls to zero
perfectly inelastic demand • vertical demand curve • change in P, no change in Qd
cross elasticity • price of related goods • negative for complements • positive for substitutes
income elasticity • change in Qd when income changes • negative for inferior goods • positive for normal goods
Shift in Supply & Demand • increase -- shift right • decrease -- shift left • price of a good WILL NOT SHIFT • demand for that good • supply of that good • will change Qd or Qs
Shift in Supply & Demand • will change equilibrium P & Q
Example 2 • Market for bottled water • sugar is found to be harmful to health • what happens to equilibrium?
Which curve is affected? • Demand curve • health concerns increase preferences for water • demand shifts right
P S Equilibrium: $10 P D’ Q D Q 10 (millions bottles per day)
concave PPF • increasing opportunity costs • resources not perfectly substitutable
Marginal Revenue Product (MRP) • = value of marginal product (VMP) • additional revenue from hiring one more unit of labor • price of good x MP • maximum firm will pay for one more unit of labor • wage < or = to MRP
Economic Rent • demand & supply of resource • price of resource • price of resource = opp. cost + any extra compensation • economic rent = extra compensation
Rent S $2500 $1200 D Q 250 500 750 rent ceiling = $1200 PRICE CEILING
Rent S $2500 SHORTAGE $1200 D Q 250 500 750 at P = $1200: Qd = 750 units Qs = 250 units PRICE CEILING
S wage $7 $5 D Q 5000 minimum wage = $7 PRICE FLOOR
S wage $7 SURPLUS $5 D Q 2500 5000 7000 at w = $7: Qd = 2500 workers Qs = 7000 workers PRICE FLOOR
Total Utility (TU) • total benefit from consuming good • increases as quantity consumed increase Marginal Utility (MU) • change in total utility from consuming one more of a good • MU falls as consumption rises
higher TU lower TU TU is higher as curve shifts right gum water