Download
1 / 17
170 likes | 280 Vues
This hearing addresses the vital components of data quality within patient medical records, emphasizing the need for accuracy and precision in clinical documentation. Joe Bormel, M.D., M.P.H., discusses the integration of descriptive documentation processes and the automation of clinical performance measures. The consequences of data inaccuracy and the importance of comparable metrics in care management are highlighted. By utilizing a lifetime medical record as a key tool in evaluating healthcare outcomes, providers can improve care quality while reducing costs and mitigating inappropriate variations in treatment.

E N D
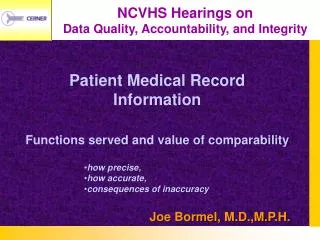
NCVHS Hearings on Data Quality, Accountability, and Integrity • Patient Medical Record Information • Functions served and value of comparability • how precise, • how accurate, • consequences of inaccuracy • Joe Bormel, M.D.,M.P.H.
Care Management Clinical Performance Measures Descriptive Documentation Process Automation Still in someone’s head, only PMRI uses, conceptual diagram Lifetime Medical Record Capturable during a clinical encounter
Critical Perspectives Data capture- a byproduct of the care process Standard definitions of data elements Descriptive Documentation Process flow is the integration glue A Lifetime Record Care Management • Leadership • Incentives • Tools Clinical Performance Measures Process Automation
Business and Clinical Problemdefinition (I.e. Bed/days per thousand, Inappropriate variation, …)
Extent of Variation Explainable From Current PMRI (ICD-9,CPT-4, groupers) # of Average Range RDRG Cases $K/Case $K__ s.d. Pneumonia 0890 110 11.54 0.7 - 56.0 8.1 # of Average Range RDRG Cases $K/Case $K__ s.d. Pneumonia 0890 110 11.54 0.7 - 56.0 8.1 Congestive 1270 168 12.70 3.7 - 174.0 14.1 Heart Failure 1271 774 16.70 1.6 - 121.5 13.1 1272 73 36.86 2.0 - 182.6 32.6 8050 20 8.14 0.461 - 23.9 5.8 # of Average Range RDRG Cases $K/Case $K__ s.d. Pneumonia 0890 110 11.54 0.7 - 56.0 8.1 Congestive 1270 168 12.70 3.7 - 174.0 14.1 Heart Failure 1271 774 16.70 1.6 - 121.5 13.1 1272 73 36.86 2.0 - 182.6 32.6 8050 20 8.14 0.461 - 23.9 5.8 Hip Surgery 2090 499 30.0 0 - 64.8 5.7 2091 225 33.7 14.2 - 146.8 11.3 2092 157 37.3 0 - 153.5 15.7 2093 22 62.0 25.2 - 257.9 50.3 1999, Cerner Corporation
Going Beyond Current PMRI Drivers: Total Cost Summary Drivers Summary Expected Cost versus ‘Us,’ (case mix adjusted) 1999, Cerner Corporation
PMRI needed to measureand improve quality and costs Cases with significant variation in costs not explained by independent drivers/triggers (age, comorbidities, event sets) Clinical Low Risk Expected performance Clinically Higher Risk Information construct: Event Set Pneumonia • Adequate reasons for higher costs • Hemodynamic instability • Extensive involvement with hypoxemia • Inability to clear respiratory secretions • Failure of outpatient treatment • Severe neutropenia under 1000/cu.mm. • Altered mental status Record one time, in granular and codified form to support all measurement needs • Inadequate reasons • Pleurisy • Cough • Fever
Value Improvement Initiativesenabled by adequate PMRI “New” Comfort Level Value Improvement Initiatives aka Medical Management “Old” Comfort Level Value Drivers: (Quality/Cost) Cost Summary Drivers Summary Time 1999, Cerner Corporation
Medical Management Programs undertaken by the Administrative, Clinical and Financial management of a provider organization to: Improve quality Lower the cost of care Reduce inappropriate variation Meet reporting requirements 1999, Cerner Corporation
The Care World Care Acuity / Cost Time 1999, Cerner Corporation
Acute / Urgent / Emergent Chronic / Disease Demand Health, Wellness, Alternative Self-Care Care Acuity / Cost Time 1999, Cerner Corporation
Populations and Care Acuity / Cost Time Population Care 1999, Cerner Corporation
Populations contracting for Care Medical Cost (Risk) Population Catastrophic | 23% 30,000 1 % | Catastrophic 23% $ 30,000 PMPY 1 % Care Chronic 33% 7,920 5 % | Chronic 33% 7,920 5 % Episodic 25% 2,143 14 % Episodic 25% 2,143 14 % Well 17% 255 80 % Well 17% 255 80 % 1999, Cerner Corporation
Medical Management Goals • PMRI: • Functions served and • value of comparability • how precise, • how accurate, • consequences of • inaccuracy Acuity / Cost Time Population Care Identify Intervene Inform
Medical Management Programs Global Health Management Pathway Management ORYX Reporting Care Case Management Cost Profiling Risk Assessments Clinical Profiling Call Centers Provider Profiling Resource Planning HEDIS Reporting Risk Management Patient Education Credentialling / Reappointment Prospective Concurrent Retrospective 1999, Cerner Corporation
Integration, Interrelationships and Management Case Management Cost Profiling Risk Assessments Clinical Profiling Population Care Prospective Concurrent Retrospective Continuity 1999, Cerner Corporation
Summary Billing data lets you evaluates patterns of resource consumption: The what, where, when, and who, but not the why or the clinical context. Without common, situation-specific, granular, codified PMRI, the consequence will be lower cost effectiveness of medical management initiatives. This current state was illustrated in the first several slides. Our greatest opportunity is PMRI, captured as a by-product of routine care, that is common and codified. This is the critical first step to quicken the pace of health care improvement. 1999, Cerner Corporation