Understanding Data Analysis with Box Plots and Dot Plots
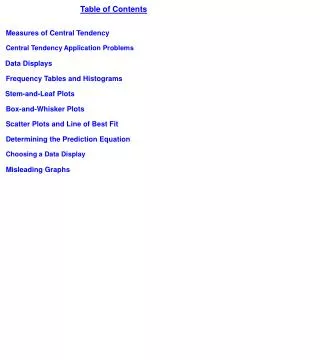
This unit covers key concepts in data analysis, focusing on box plots and dot plots as graphical representations of distributions. We explore the significance of the five-number summary (minimum, maximum, median, and quartiles) in creating box plots and why the median is used as a measure of center due to its resistance to outliers. Through practical examples and interactive group activities, students will learn to construct box plots, analyze data using SOCS (Shape, Outlier(s), Center, Spread), and compare the advantages and disadvantages of different graphical methods.

Understanding Data Analysis with Box Plots and Dot Plots
E N D
Presentation Transcript
Unit 2 : Data Analysis Box Plots CCSS: S.ID.1, S.ID.2, S.ID.3
Graphical Representations Recap • Graphical representations are good because...? 2) Dot plots are a good graphical representation of a distribution if the data...?
The 5 Number Summary IQR Maximum Median Minimum 1st Quartile 3rd Quartile
Box Plots Germany Japan France USA 10 15 20 25 30 35 40 45
Why do we use the median in box plots? • The median is a measure of the “center” • There are other measures of center, like the mean or the mode • Why do we use the median (and not the mean or mode) in box plots? It is resistant to outliers.
Let’s look at a simple distribution ... Cost of five randomly selected jeans: $27, $27, $29, $35, $59, $450 • What’s the mode? _______ • What’s the mean? _______ • What’s the median? _______
We use the median in box plots because... • The median is resistant to outlier(s) (in other words, it is not influenced by extreme values) • The median helps create a box plot that is not misleading
Steps to Organize Data: 1) Arrange data smallest to greatest 2) Count in and find middle value (median) 3) Count in and find 1st quartile 4) Count in and find 3rd quartile 5) Identify minimum and maximum
Example. A random sample of 21 juniors at WRHS were asked how many songs on their iPods.
Create box plot: Remember to put horizontal scale on bottom, labeled; label with values of each of the 5-number summary; use context labels to clearly state what the box plot represents.
SOCS (Shape, Outlier(s), Center, Spread) • Let’s analyze the data using SOCS
What do you think are pros and cons of using a box plot or dot plot?
Did you think of these possible advantages and disadvantages? • Pros/Advantages: • we see overall shape and trends well in box plot • we keep original data when doing a dot plot • Cons/Disadvantages: • we lose the original values when creating a box plot • sometimes more difficult to see trends and overall shape of data in dot plot if data is spread out a lot
Group Work - Box Plot Activity 1) Complete Speed Trap Problem together. When done, raise your hands and I will bring you your poster. 2) Using the same data as last time, create a Box Plot poster. • Compare the two plots (which one helps you see/understand the data better?)
Box Plots Germany Japan France USA 10 15 20 25 30 35 40 45