Download
1 / 25
250 likes | 416 Vues
GREENHOUSE GAS 101. Policy Matters Ohio All materials taken from Dr. Hummel’s Climate Policy Design website. Explaining the Greenhouse Effect. Figure: www.myclimatechange.net. Warming is unequivocal: clear and unambiguous. Source: IPCC, AR4, WG1, Chap 6, Fig. 10.

E N D
GREENHOUSE GAS 101 Policy Matters Ohio All materials taken from Dr. Hummel’s Climate Policy Design website
Explaining the Greenhouse Effect Figure: www.myclimatechange.net
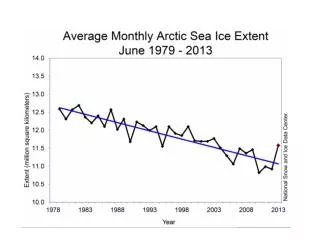
Warming is unequivocal:clear and unambiguous. Source: IPCC, AR4, WG1, Chap 6, Fig. 10
Rise in CO2 Concentration is Accelerating. Scripps Institution of Oceanography NOAA Earth System Research Laboratory Scripps Institution of Oceanography NOAA Earth System Research Laboratory
One fifth of our CO2 emissions today will remain in the air in 3009 Atmos. Chem. Phys.7, 2287-2312, 2007
Stabilization of CO2 concentration, temperature, and sea level takes centuries after emissions are reduced IPCC TAR SYN SPM Fig 5-2
Water supply in Himalayan watersheds is a major humanitarian concern. Rongbuk glacier in 1968 (top) and 2007. The largest glacier on Mount Everest’s northern slopes feeds Rongbuk River. Slide from Dr. James Hansen’s Congressional briefing June 23, 2008.
Cap-and-Trade Systems Under Development EU Emissions Trading System (EU ETS) Western Climate Initiative (WCI) Participant Observer Regional Greenhouse Gas Initiative (RGGI, “Reggie”)
Cap-and-Trade Climate Policy Got it? A familiar game can help illustrate the concepts… • “Cap-and-trade” means a government authority establishes a cap that limits the total amount of pollution allowed, and then distributes allowances for “permission to pollute” the global atmosphere, which can be traded as private property. • The amount of greenhouse gas emissions permitted declines each year, creating demand for a new commodity: carbon permits. • When offered enough money (or faced with high enough costs), polluters who own permits (or need permits) will reduce their emissions. • These trades establish a market price for greenhouse gas pollution.
Musical Chairs A Helpful Analogy for Managed Scarcity If you have an “allowance”, you can have a chair. Each chair represents the “permission to pollute”: one metric ton of carbon dioxide (1 mtCO2) or an equivalent amount of any other greenhouse gas
Players: Polluters at Points of Regulation Chemical companies Power Plants Oil Refineries Natural Gas companies Aluminum smelters
Cap-and-Trade Declining Cap Covered Entities
Carbon Price Established by Market Activity So, is it more profitable to: buy a permit, OR reduce my own emissions? Profit opportunities are a main driver for innovation and investment, and the climate challenge needs both.
Carbon Price Established by Market Activity $40 Would anyone accept $40 for your permit?
Carbon Costs Passed to Consumers Sending a price signal is the point of the policy! $40 $40 $40 $40 $40 35¢ per gallon 2.5 ¢ per kWh 0.6 ¢ per therm People Respond…?
Moving to Clean Energy 2010 2020 2030 2050 2040 Rail Transport Hybrid vehicle Nuclear power Solar power Wind power Green buildings $100 $50 $200 $30 $20 $150 Players seek better options as costs rise. Cap-and-trade lets players choose at what price they leave the game – and how they want to make that change.
h Price On Carbon Demand $50 $20 Quantity of Permitted Emissions 50 MtCO2 100 MtCO2
Price On Carbon Supply $50 $20 Quantity of Permitted Emissions 50 MtCO2 100 MtCO2
Carbon Cap vs. Carbon Tax Price On Carbon Supply Demand P Quantity of Permitted Emissions Q
Carbon Cap vs. Carbon Tax Price On Carbon Cap Demand P Quantity of Permitted Emissions Q
Carbon Cap vs. Carbon Tax Price On Carbon Demand Tax P Quantity of Permitted Emissions Q
Carbon Cap vs. Carbon Tax Carbon Cap Price On Carbon Demand Demand Carbon Tax P P Q Q Quantity of Emissions Should we set the quantity and let markets determine the price for a scarce resource? Should we set the price and let markets determine the quantity of pollution?
JOBS: New Green Jobs LEAKAGE
Climate Policy Design • All credits to Dr. Holmes Hummel of the University of California • Google ‘Climate Policy Design for complete curriculum • These slides were taken from her site, which is available for your use as well – a great resource of explaining climate policy to your colleagues and members.