Download
1 / 4
Atmospheric O2 Concentration Trends Over Time
40 likes | 145 Vues
Explore historic atmospheric oxygen levels relative to 1985 through greenhouse gas concentration records. Data from the World Data Center for Paleoclimatology, NOAA. Visit http://scrippso2.ucsd.edu/ for more details.
Télécharger la présentation 
Atmospheric O2 Concentration Trends Over Time
An Image/Link below is provided (as is) to download presentation
Download Policy: Content on the Website is provided to you AS IS for your information and personal use and may not be sold / licensed / shared on other websites without getting consent from its author.
Content is provided to you AS IS for your information and personal use only.
Download presentation by click this link.
While downloading, if for some reason you are not able to download a presentation, the publisher may have deleted the file from their server.
During download, if you can't get a presentation, the file might be deleted by the publisher.
E N D
Presentation Transcript
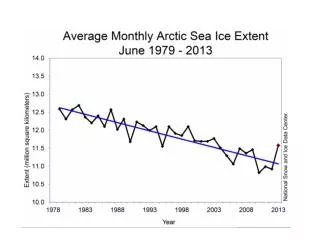
Atmospheric greenhouse gas concentration Year These records are maintained by the World Data Center for Paleoclimatology, National Oceanic and Atmospheric Administration
Year This plot show the atmospheric O2 concentration relative to the level around 1985. http://scrippso2.ucsd.edu/


More Related