Download
1 / 26
260 likes | 358 Vues
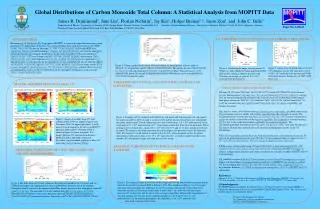
TCCON is a ground-based network using Fourier Transform Spectrometers for accurate greenhouse gas measurements. Explore satellite validation and observational sites like WLEF tower in Wisconsin for comprehensive carbon monitoring.

E N D
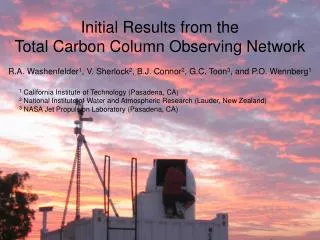
Initial Results from the • Total Carbon Column Observing Network • R.A. Washenfelder1, V. Sherlock2, B.J. Connor2, G.C. Toon3, and P.O. Wennberg1 • 1 California Institute of Technology (Pasadena, CA) • 2 National Institute of Water and Atmospheric Research (Lauder, New Zealand) • 3 NASA Jet Propulsion Laboratory (Pasadena, CA)
Total Carbon Column Observing Network TCCON is a new network of ground-based near-infrared Fourier Transform Spectrometers dedicated to measurement of greenhouse gases. Goals for the TCCON Network 1) Assist in constraining the global carbon budget Compared to surface in situ measurements, column measurements are: • Less sensitive to local sources and sinks • Less sensitive to diurnal and seasonal “rectifier” effects 2) Validate satellite remote sensing instruments • The Orbiting Carbon Observatory (OCO) • SCIAMACHY • The Greenhouse Gases Observing Satellite (GOSAT) To learn more about satellite validation: “Overview of OCO Validation” – R. J. Salawitch “Precision Requirements For Space-Based XCO2 Data” – C.E. Miller
Total Carbon Column Observing Network Sites Current Near-IR Solar Observatory Planned Near-IR Solar Observatory Other Future Possibilities
Tall Tower Site in Park Falls, Wisconsin 447-m WLEF tower The laboratory is located next to the 447-m tall WLEF tower, in the Chequamegon National Forest. This is a site of intensive field measurements by NOAA and other collaborators: • Continuous CO2 monitoring at six levels on Tall Tower • CO2 flux measurements • Weekly flask sampling and monthly aircraft profiles by NOAA CMDL
Solar Beam Interferometer Scanner Detectors Park Falls Automated Solar Observatory Direct sunlight is absorbed at specific wavelengths by atmospheric gases. A Fourier Transform Spectrometer (FTS) records direct solar spectra at high spectral resolution. Measurements are acquired when the sun is unobscured: • 105 seconds per spectrum. • Full spectrum obtained between 3,900 – 15,600 cm-1 (2.56 – 0.64 μm). • Instrumental alignment is monitored using a sealed cell containing HCl gas. Gases with absorption features in the near-IR: CO2, CH4, CO, N2O, H2O, HDO, HF, and O2. Solar tracker Bruker 120HR spectrometer
Spectral Fitting of Carbon Dioxide Single forward spectrum (resolution = 0.02 cm-1) recorded at 9:30 am on 9 September 2004. Column CO2 = 7.6466 x 10²¹ molecules cm-2 Column CO2 / Total Dry Column = 373.94 ± 0.37 ppmv
Calibration of Absolute Column CO2 Using Aircraft Data Intercontinental Chemical Transport Experiment – North America (INTEX-NA) • NASA DC-8 and King Air measured in situ CO2 during tower profiles • Eight unique aircraft profiles: DC-8: July 12, July 15 (twice) King Air: July 14, July 15, August 14, August 15 (twice) Allows us to place our column CO2 retrievals on the same scale as the in situ network. DC-8 Flight Path and Photograph from 12 July:
FTS Column and Aircraft In Situ Data – 12 July 04 AIRCRAFT PROFILE: FTS RETRIEVAL: FTS Column / Total Dry Column = 375.5 ± 0.25 ppmv 371.4 ± 0.27 ppmv Aircraft Column / Total Dry Column = 372.5 ± 0.52 ppmv
Diurnal Variation of Column and Tall Tower CO2 12 ppmv 15 ppmv Relationship between column and in situ CO2 is influenced by: • Drawdown due to photosynthesis • Regional mixing • Boundary layer dynamics Arlyn Andrews – preliminary NOAA CMDL Tall Tower data
Column and Tall Tower CO2 during May 2004 – May 2005 Related poster: “Using A High Resolution Coupled Ecosystem-Atmosphere Model To Evalulate Spatial, Temporal, and Clear-Sky Errors in Satellite CO2 Measurements” – K.D. Corbin
TCCON Measurements and Model Predictions Vanessa Sherlock and Brian Connor – Lauder CO2 columns Seth Olsen – MATCH model results
Summary Park Falls, Wisconsin: • An automated solar observatory has been operational since May 2004. • Demonstrated precision of ~0.1% for column CO2. • Linear relationship between column CO2 and integrated aircraft profiles can be used to correct the absolute accuracy of the column CO2 measurements. Total Carbon Column Observing Network: • Initial comparisons between Park Falls, Wisconsin and Lauder, New Zealand show that these measurements will capture the interhemispheric seasonal cycle of CO2.
Acknowledgements Caltech FTS data: Jean-Francois Blavier, Geoffrey Toon, Zhonghua Yang, Yael Yavin, Paul Wennberg Lauder FTS data: Vanessa Sherlock and Brian Connor WLEF Tall Tower data: Arlyn Andrews DC-8 CO2 profiles: Stephanie Vay King Air CO2 profiles: Steven Wofsy and Daniel Matross Stratospheric CO2 profile: Bruce Daube and Steven Wofsy Funding: NASA Atmospheric Chemistry, Modeling, and Analysis Program NASA Terrestrial Ecology Program NASA Orbiting Carbon Observatory
Solar Spectrum Recorded in Park Falls, Wisconsin Individual CO2 Lines: InGaAs Detector Transmission Si Diode Detector CO2 Wavelength (cm-1) CO2 O2 O2 Single forward spectrum recorded at 9:30 am on 9 Sept 2004. Resolution = 0.02 cm-1. Signal-to-noise: InGaAs Detector ~885; Si Diode Detector ~465
Analysis Method: GFIT • Line-by-line fitting algorithm for solar absorption spectra • Developed at the Jet Propulsion Laboratory by Geoff Toon • Least squares analysis in spectral window to determine slant column abundances for the absorbing gases • Definition of the fitting residual: • Atmosphere is represented by 70 vertical levels in forward model • Pressure and temperature profiles taken from NCEP Reanalysis, with 17 levels from 1000 – 10 mb with 1°×1° geographic resolution • Climatological temperature profiles used for levels with pressures ≤10 mb
Most Recent Park Falls Data ∆Column CO2 on sunny days: ~3 ppmv day-1 = -12.3 gC m-2 day-1 Davis et al (2003) average daytime NEE June – August 1997 = -4.46 gC m-2 day-1
Treatment of Aircraft Profiles Profile has been integrated from surface pressure to top of atmosphere. BELOW AIRCRAFT PROFILE: Assume that median PBL CO2 extends to surface AIRCRAFT PROFILE: ABOVE AIRCRAFT PROFILE: Tropopause taken from NCEP reanalysis Assume that median free tropospheric CO2 extends to tropopause. Stratospheric CO2 profile is taken from September 2004 balloon profile. Assume that CO2 = f(Θ) is reasonably constant in the stratosphere over this time difference.
Averaging Kernels in FTS – Aircraft Comparison Definition of the averaging kernel: X_hat = (I – A) × Xa + A × X X_hat = retrieved CO2 X = true CO2 A = averaging kernel Xa = a priori profile I = identity matrix
Model Predictions for Column CO2 at 45 °N and 45 °S Observed peak-to-peak seasonal amplitude of measured column CO2 compared to model predictions by Olsen and Randerson [2004]: Model predictions are roughly consistent with actual column measurements. Plans for continued investigation: Modeling • accuracy of surface flux inventories • parameterization of mixing Column measurements: • verify that no FTS retrieval bias exists which is dependent on solar zenith angle e.g. averaging kernels or systematic error in the CO2 air-broadened width parameters Inherent differences between the measurement and the model • comparison of spatially-averaged model results with point observations
Darwin, Australia Site DOE Atmospheric Radiation Measurement Site Located on northern Australian coast in the tropics Three seasons: Dry continental regime from May – September Wet monsoonal season from December – March Transitional period between Existing ARM measurements: Cloud properties, surface meteorology, atmospheric profiling, aerosol properties
TCCON Measurements and Model Predictions Vanessa Sherlock and Brian Connor – Lauder CO2 columns Seth Olsen – MATCH model results