Download
1 / 1
10 likes | 113 Vues
Global Distributions of Carbon Monoxide Total Column: A Statistical Analysis from MOPITT Data. James R. Drummond 1 , Jane Liu 1 , Florian Nichitiu 1 , Jay Kar 1 , Holger Bremer 1 ,2 , Jason Zou 1 , and John C. Gille 3

E N D
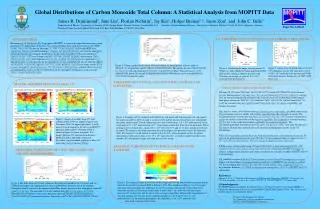
Global Distributions of Carbon Monoxide Total Column: A Statistical Analysis from MOPITT Data James R. Drummond1, Jane Liu1, Florian Nichitiu1, Jay Kar1, Holger Bremer1,2, Jason Zou1, and John C. Gille3 1Department of Physics, University of Toronto, 60 St. George Street, Toronto, Ontario, Canada M5S 1A7 2Institute of Environmental Physics, University of Bremen, PO Box 330440, D-28334, Bremen, Germany 3National Center for Atmospheric Research, P.O. Box 3000, Boulder, CO 80307-300, USA Paper No: A43B-01 CO VARIATION WITH ELEVATION AND A SHORT TERM TREND INTRODUCTION Measurements Of Pollution In The Troposphere (MOPITT) is a sensor developed for measuring carbon monoxide (CO) and methane from space. It is on board NASA Terra earth observation system (EOS) satellite, which was launched on December 18, 1999. CO measurements made by MOPITT have significantly enhanced our understanding of temporal and spatial distributions of CO in the atmosphere and the mechanisms governing the distributions. In this study, the global CO data are statistically analyzed in terms of CO total column variations with time, latitude, longitude, and elevation. These statistics provide a new and comprehensive overview of global CO distributions in a quantitative way. This information is useful not only for the atmospheric science community but also for other disciplines and the public, owing to the importance of CO as a major pollutant, a precursor of ozone, and its effects on many atmospheric chemical processes. The CO data have illustrated the combined effects of natural and anthropogenic factors on the CO distributions in the atmosphere. Preliminary results from the analysis are presented in this poster. Figure 3. Taking a global mean of daily CO total column, an annual pattern with two peaks is obtained, one in April-May and the other in October-November. This pattern has been repeated for the last four years with some interannual variations in magnitude and phase. This pattern may not be captured if the global CO amount is integrated from surface observations, and is not reproduced in some chemical transport models. Figure 7. A time series of global daily mean total CO column for 4 years. The short time trend of 0.025 1018 molecules/cm2 per year may result from much biomass burning in year 2002 (an El Nino year). Figure 6. Overlaying the image of yearly mean CO (Figure 1c) with a digital elevation map from USGS, the total CO column is found to decrease with elevation, on average, at a rate of 0.3 1018 molecules/cm2 per kilometer. VARIATION OF CO TOTAL COLUMN WITH LATITUDE AND LONGITUDE SPATIAL DISTRIBUTION OF GLOBAL CO DISCUSSION AND CONCLUSIONS • Among all CO source/sink terms, the loss due to CO reaction with OH and the emission from biomass burning appear to be main causes for seasonal fluctuation of CO total column. In a normal year, the former predominantly determines the seasonal course of CO abundance in the northern hemisphere whereas the latter has a great influence on the course in the southern hemisphere. As a result, the seasonal variation of global mean CO generally shows two peaks in April-May and October-November. • As land is a source of CO and the fraction of land increases with latitude, the global annual mean CO total column increases rapidly with latitude, especially from the south pole to equator. The longitudinal mean CO varies less than that across latitudes. The rate of CO increase with latitude is usually the smallest in June/July and the largest in April/May. The amplitude of seasonal variation of CO is low in the southern hemisphere and high in the northern hemisphere. The latitudinal/longitudinal distributions generally agree with previous studies with some discrepancies. All of these illustrate the combined effects of natural and anthropogenic factors on the CO distributions. • The CO total column generally decreases with elevation because of the reduction of air mass. In terms of the global annual mean for year 2000, the CO total column declines at a lapse rate of 0.3 1018 molecules/cm2 per kilometer. This rate changes in different regions and seasons. • With a series of daily global mean CO from 2000 to 2004, a short-time trend of 0.025 1018 molecules/cm2 per year is found. A long-term trend can be established if MOPITT continues on orbit for a longer period and other space-borne instrument are available to replace MOPITT when it is not operating. • It should be recognized that the CO total column is retrieved from CO mixing ratios at several heights with knowledge of averaging kernels and a priori. As MOPITT is not sensitive to surface CO, this may bring about errors in the retrieved CO total column. After comparing with in situ measurement, Emmons et al. (2004) have reported an average bias of 511% in MOPITT total CO column data. References Emmons, L.K., et al., Validation of Measurements of Pollution in the Troposphere (MOPITT) CO retrievals with aircraft in situ profiles, J. Geophys. Res., 109(D3), D03309, 10.1029/2003JD004101, 14 February 2004. Figure 4. Examples of CO variations with latitude (4a, left panel) and with longitude (4b, right panel) for yearly mean CO in 2000. As land is a source of CO and the fraction of land increases with latitude, the global annual mean CO total column increases with latitude from ~1.0 1018 molecules/cm2 in the south pole to 2.1 1018 molecules/cm2 at 0 , then remains around that level up to the north pole. When looking at CO over land only, a peak of 2.3 1018 between 10 S and 10 N and a trough at 34 N can be found. The former results from vegetation fires in the tropics and the latter is due to the Plateau of Tibet. The trend of CO with latitude is similar to that for CO2. Along longitude circles, the global annual mean CO fluctuates from 1.6 to 1.9 1018 molecules/cm2, a variation smaller than that across latitudes. The fluctuation is larger over land than over the oceans. Figure 1. Images of monthly mean CO total column in May 2000 (1a, upper left panel) and November 2000 (1b, upper right panel). A yearly mean CO total column for the first year MOPITT operation (March 2000 – February 2001) is shown in Figure 1c (lower left panel). The images illustrate CO emission from biomass burning in Africa and South America in November, large latitudinal gradients in May and many other features discussed below. SEASONAL VARIATION OF CO TOTAL COLUMN WITH LATITUDE TEMPORAL VARIATIONS OF CO IN THE GLOBE AND THE TWO HEMISPHERES Figure 5. This figure provides an overview of the changes in CO with both latitude and month in more detail for the period from March 2000 to February 2001. This supplements Figure 2 on CO changes with time (horizontal direction) and Figure 4a on CO variations with latitude (vertical direction). Vertically, the rate of CO increase with latitude is only 0.006 1018 molecules/cm2 per degree between 60 in June/July, and the rate is twice as large in April/May. Horizontally, the amplitude of seasonal variation of CO is low in the southern hemisphere at 45 S and 5 S (0.4 1018 molecules/cm2). In the northern hemisphere, the amplitude is ~0.6 1018 molecules/cm2 with small variations with latitude. Figure 2. The daily mean of CO total column in the northern hemisphere (2a, left panel) and the southern hemisphere (2b, right panel) for 4 years (2000-2004). The mean CO of the northern hemisphere usually reaches its maximum in April-May, mainly because of low atmospheric oxidation capacity at the time. The maximum CO in the southern hemisphere often appears in October-November due to large fire events and is therefore somewhat variable. The general pattern is associated with large interannual variations. Notice the scale for the southern hemisphere is lower. Acknowledgments The MOPITT project is funded by the Natural Sciences and Engineering Research Council (NSERC) of Canada, the Meteorological Service of Canada and the Canadian Space Agency (CSA). The US team and the Terra spacecraft are funded by NASA. For more information, please contact: Jim Drummond, jim@atmosp.physics.utoronto.ca Jane Liu, jliu@atmosp.physics.utoronto.ca