Math 113
Math 113. Chapters 7-8 Review. #2. Identify which statement is the null hypothesis and which is the alternative hypothesis. A corpse is dead A corpse is alive. The car has gasoline in it The car is out of gas. #3.

Math 113
E N D
Presentation Transcript
Math 113 Chapters 7-8 Review
#2 Identify which statement is the null hypothesis and which is the alternative hypothesis. • A corpse is dead • A corpse is alive • The car has gasoline in it • The car is out of gas
#3 Identify which statement is the type I error and which is the type II error. • An unnecessary hysterectomy is performed • A hysterectomy is not performed when it should be
#4 All hypothesis testing is done under the assumption that the null hypothesis is true.
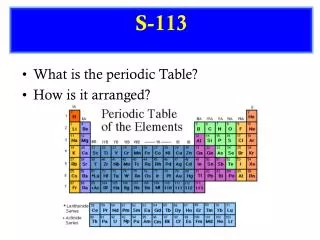
#7 A Kolmogorov-Smirnov test is performed on a sample and the following p-values are found. Distribution p-valueNormal 0.0321Uniform 0.3215Exponential 0.1246Jones Fictional 0.0257 • Does the sample appear to be Uniformly distributed? • Does the sample appear to have a Jones Fictional Distribution?
#9 Identify the test as left-tailed, right-tailed, or two-tailed and give the decision (reject or fail to reject H0) • If there are two critical values, it is a two-tail test. • If the critical value is less than the mean, it is a left-tail test. • If the critical value is greater than the mean, it is a right-tail test.
#9 continued • The mean of a normal or student’s t distribution is 0. • The mean of a chi-squared distribution is its degrees of freedom. • The mean of an F distribution is approximately 1. Reject the null hypothesis if the test statistic is more extreme (in the direction of the type of test) than the critical value – that is, if it lies in the critical region.
#9 continued again Critical Value: t = -3.215Test Statistic: t = -2.843 Critical Value: = 35.832Test Statistic: = 41.721df = 18
#10 Harry claims that there is no agreement (null hypothesis) between the judges of the skating competition. Kendall’s concordance of agreement was computed and the p-value was found to be 0.1275. • The decision is to (reject / fail to reject) the null hypothesis. • There is (sufficient / insufficient) evidence to (support / reject) the claim that there is no agreement. • There is (sufficient / insufficient) evidence to (support / reject) the claim that there is agreement.
#11 Give the decision based on the p-value. • Reject the null hypothesis when the p-value is less than the level of significance. • Fail to reject the null hypothesis when the p-value is greater than the level of significance • P-value=0.3158, alpha = 0.3927 • P-value=0.1253, alpha = 0.1025
#28 Write the null and alternative hypothesis and identify the test as left tailed, right tailed, or two-tailed. • 24% of Americans smoke • The average smoker began smoking before age 16 • Professional baseball players earn more than professional football players • The standard deviation on the last test was 15. • More women than men read Cosmopolitan.
#28 continued 1. 24% of Americans smoke 2. The average smoker began smoking before age 16
#28 continued 3. Professional baseball players earn more than professional football players 4. The standard deviation on the last test was 15
#28 continued 5. More women than men read Cosmopolitan
#30 - #33 Using Microsoft Excel to find critical values • The functions and the definitions of those functions are given on the test. • Be sure to enter the equal sign at the beginning of the function • Be sure you pay careful attention to the definition. Sometimes Excel expects a right tail probability, sometimes a left tail probability, and sometimes a two-tail probability. The critical value notation given on the test is ALWAYS a RIGHT TAIL area.
#30-#33 continued Find =CHIINV(prob,df) Returns the critical value from the chi-squared distribution with df degrees of freedom and prob area in the right tail. Since we are looking for a right tail area (always in the critical value notation) and Excel is expecting a right tail area, we can just enter the function as =CHIINV(0.83,18) and Excel gives us the value 12.325 after we hit enter
#34 A test statistic from a sample of n=16 items is found to be t=1.531. If this is a right tail test, find the two values that the probability value lies between. One Tail 0.025 0.05 0.10 0.25Two Tail 0.05 0.10 0.20 0.50 df=15 2.131 1.753 1.341 0.691 Since the test statistic is between 1.753 and 1.341 and it is a one-tail test, the p-value is between 0.05 and 0.10, the one-tail probabilities associated with each of those critical values. 0.05 < p-value < 0.10