Download

1 / 18
180 likes | 222 Vues
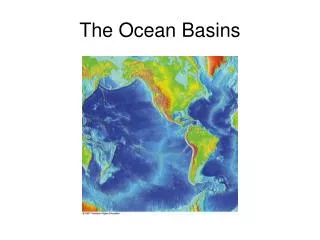
Explore the importance of improved bathymetry in deep oceans for global mapping, outreach, and various applications. Discover ways to enhance data sources and methodologies for a comprehensive understanding of the ocean floor.

E N D
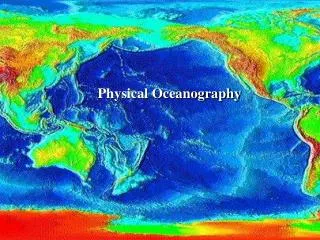
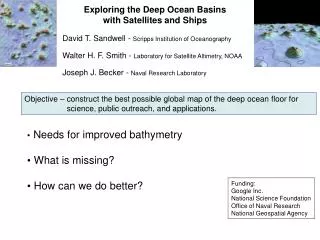
Exploring the Deep Ocean Basins with Satellites and Ships David T. Sandwell - Scripps Institution of Oceanography Walter H. F. Smith - Laboratory for Satellite Altimetry, NOAA Joseph J. Becker - Naval Research Laboratory Objective – construct the best possible global map of the deep ocean floor for science, public outreach, and applications. • Needs for improved bathymetry • What is missing? • How can we do better? Funding: Google Inc. National Science Foundation Office of Naval Research National Geospatial Agency
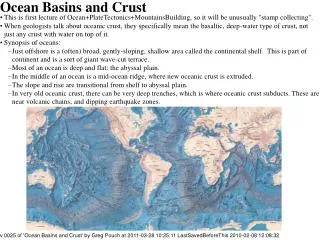
Needs for Improved Bathymetry in the Deep Oceans • Outreach and applications • education and outreach • military applications • Industry applications • Science • global tectonics, seafloor roughness • seamounts • tsunami models • ocean circulation and tides • marine ecosystems • planning tool
modern mapping tools satellite altimeter multibeam echo sounder
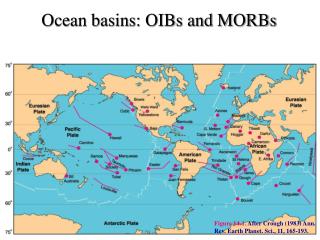
Data Sources multi-beam soundings predicted from satellite gravity single-beam soundings
How can we do better? • Improve public archives of bathymetry. • Map the oceans with multibeam echosounders - ships of opportunity. • Acquire new satellite altimeter data. • Declassify US Navy bathymetry data.
Conclusions Objective – construct the best possible global map of the deep ocean floor for science, public outreach, and applications. • ½ of seafloor is more than 10 km from a depth sounding – mostly southern oceans • We can improve deep ocean bathymetry by: • improve public archives and encourage data sharing (e.g. declassify US Navy data) • constructed low-resolution bathymetry from satellite gravity • map oceans with ships of opportunity guided by satellite gravity data available at: http://topex.ucsd.edu
1/2 of global seafloor is more than 10 km from a depth sounding [Smith and Marks, 2009]
uncharted seamounts > 3 km tall
Grounding of USS San Francisco on Uncharted Guyot • Los Angeles class Submarine ran aground in route from Guam to Brisbane, Australia - 8 January, 2005 • One sailor killed, 120 injured • Crash depth ~160 m, speed 33 kn, Sonar measured a depth of 2000 m, 4 minutes before crash • 30-hour trip back to Guam, crew managed to keep the sub from sinking • Area of discolored water noted on navigational chart 4.8 km, south of crash site • Navy began basing attack submarines in Guam in 2002
Grounding of USS Guardian on Tubbataha Reef • Background. USS GUARDIAN ran aground on Tubbataha Reef on 17 January 2013 at 0222(H). The grounding caused damage to a protected reef and necessitated a lengthy and expensive salvage effort that resulted in the total loss of one of 14 MCMs in the United States Navy inventory. • Causation. This tragic mishap was wholly preventable and was the product of poor voyage planning, poor execution, and unfortunate circumstances. . . . the leadership and watch teams relied primarily on an inaccurate Digital Nautical Chart (DNC) coastal chart during planning and execution of the navigation plan.
Ship of Opportunity Example Capetown to Punta Arenas - Melville - Feb, 2011 red - great circle = 6896 km green - 10 new seamounts = 7130 km (1.034) violet - 11 new seamounts = 7069 km (1.025)
Actual tracks Capetown to Punta Arenas - Melville – March, 2011
MEDEA: Scientific Utility of Naval Environmental Data, (Mitre, Co., June, 1995)
MEDEA: Scientific Utility of Naval Environmental Data, (Mitre, Co., June, 1995)