Download
1 / 28
280 likes | 312 Vues
7. OLIGOPOLY. Contents. oligopoly features specific models of oligopoly behaviour: cartel Cournot model dominant firm (price leader) oligopoly Sweezy model with kinked demand curve Nash equilibrium. Oligopoly features. relatively few firms in the industry (two at least)

E N D
Contents • oligopoly features • specific models of oligopoly behaviour: • cartel • Cournot model • dominant firm (price leader) oligopoly • Sweezy model with kinked demand curve • Nash equilibrium
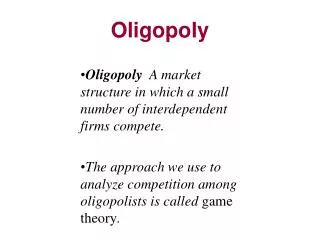
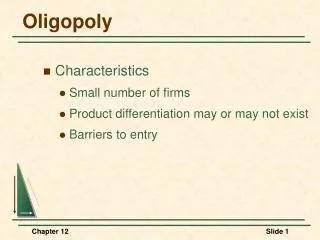
Oligopoly features • relatively few firms in the industry (two at least) • firms are highly dependend on each other´s behaviour (tendency to copy the behaviour)... why? • product can be homogenous or different • meaningful barriers to enter/leave the industry (but not impassable), often: • economies of scale, limit prices, legal restrictions, differentiation costs etc. • oligopolistic firm is a price maker
Cartel • cartel = collusive oligopoly • group of firms behaving like a monopoly with several factories • cartel´s aim = to maximize economic profit of the entire cartel (not each firm) • π = P.Q – [TC1(q1) + TC2(q2) +…+ TCn(qn)]max. • MR(Q) = MCi(qi) • cartels: OPEC (explicit cartel), gas retailers + banks (inspected cases in the CR)
Cartelequilibrium MR(Q) = MCi(qi) Firm B Firm A Industry CZK/Q CZK/Q CZK/Q ∑MC MC1 MC2 AC2 AC1 PC D MR(Q) q2 q q1 q Q* Q Equilibrium output and price of cartel si derived from intersection of industry MC and MR PC – cartel equilibrium price, q1,q2 equilibrium outputs of cartel firms
Fundamentalproblemsofcartel Cartel is generally unstable, because: • mostly illegal... • ...so legally unenforceable to keep the cartel price (or production qouta) • if different profits of cartel firms, tendencies to break the cartel price (or production quota) • tendencies to decrease the price (or increase production) to increase firm´s profit
Cournotmodel Assumptions: • 2 firms in the industry (duopoly) • homogenous production – equal cost functions • firms know the market demand • firms consider the othe firm´s output as constant – firms do not ancitipate each other´s reaction on the change of output or price • MC = AC – constant (we assume that MC=0)
Cournotmodel – equilibriumformation 1st firm enters the market and behaves as monopoly - MR1 derived from the market demand, equilibrium output = 50 2nd firm enters the market and knows about the production of the 1st firm. 2nd derives its individual demand D2 and MR2 functions, equi. q=25 P Now, the 1st firm can see it is not alone on the market, so it rearranges its individual demand to D1´. Equilibrium output of the 1st firm decreases to 37,5 units (MR1'=MC) D2' 2nd firm reacts and increases its individual demand to D2´. Equilibrium output increases to 31,25 units (MR2'=MC) D2 etc. D1=DT D1' AC=MC 25 50 100 Q MR2 MR1 MR2' MR1'
Cournotmodel – equilibrium Demand curves of both firms are aproaching to each other until they are equal. Both firms produce equal outputs for equal prices P P1=P2 D1=D2 DT AC=MC q1=q2 Q MR1=MR2
Cournotmodel – reactioncurves • each firms while deriving of the equilibrium output q1 expects that the other firm supplies output q2→ Q = q1+q2 • then profit functions of both firms: π1=TR1-TC1 = P(q1+q2).q1 – TC(q1) π2=TR2-TC2 = P(q1+q2).q2 – TC(q2) • for the specific market demand curve: P=200–Q, stands: • P=200 – (q1+q2) → TR1=[200 – (q1+q2)].q1 TR2=[200 – (q1+q2)].q2
Cournotmodel – reactioncurves • upon zero MC, for maximal profit MR equals to zero: • MR1=200–2q1–q2=0 → q1=(200–q2)/2 • MR2=200–q1–2q2=0 → q2=(200–q1)/2 • equations for q1 and q2 represent the functions of reaction curves • reaction curve as a function of output of the other firm: q1=f(q2), q2=f(q1)
Cournotmodel – equilibriumuponreactioncurves q2 200 q1=(200–q2)/2 100 q2* q2=(200–q1)/2 q1* 100 200 q1
Cournot model - application • we probably do not find examples of „pure“ Cournot model markets, but...... • ...we can find a Cournot model behaviour • KFC vs. McD... Twister vs. Chicken Roll respectively • Conservatives vs. Social democrats... their programs respectively • Mobile telecommunication providers (more than 2 firms)
Dominant firm (price leader) oligopoly • dominant firm = price leader • other firms = competitive margin firms • competitive margin has to follow the price of the dominant firm (perfect competition conditions) • max. profit of dominant firm: MR=MC • max. profit of competitive margin: P=MCi(qi)
Dominant firm oligopoly - equilibrium Dominant firm output derived from MR=MC → QDfor PD ∑MC=SCM P Competitive margin follows the price PD and supplies the QCM MC P1 Market output (QM) upon PD as a sum of QM and QCM PD DD P2 DM MR QCM QD QM Q Upon P1 and above the entire market demand is served with the competitive margin firms Upon P2 and below, QD = QM Price P2 represents the shut down point of competitive margin firms
Dominant firm oligopoly - apllication • electricity production in the CR – ČEZ, a.s. approx. 75% market share • Student Agency (bus traffic between Brno and Prague) • Telefónica O2 CR – approx. 84% market share in the segment of fixed lines
Sweezy model with kinked demand curve Assumptions: • heterogenous production • if the specific firm decreases its equilibrium price, other firms will follow • if the specific firm increases its equilibrium price, other firms will not follow Kinked individual demand curve
Sweezy model with kinked demand curve D1: if the firm increases its price, others will not follow D2 P MC2 D2: if the firm decreases its price, others will follow MC1 P* D1 MR1 D Q* MR2 Q If the specific firm increases its price, it shifts alongside D1, if decreases its price, it shifts alongside D2 If MC functions come through the discrete interval of MR function, equilibrium output lies in Q*, equilibrium price in P* - firm´s equilibrium lies in the spot of kinked demand This model explain the price rigidity in the oligopolistic markets
Nashequilibrium • game theory models • players – strategy - results • firms´ behaviour: cooperative or non-cooperative • cooperative behaviour – firms are allowed to make deals about their strategies • non-cooperative – firms are disallowed to make any deals • one-shot games vs. repeated games (one attempt to choose the strategy vs. several attempts to choose the strategy) • we assume 2 players with 2 strategies
Nashequilibrium = consequence of specific strategies that lead to the stable solution – no need to re-value the behaviour Nash equilibrium turns up, if: 2 players A and B take out of 2 strategies a and b, whereas a is the best strategy for player A if player B picks strategy b and vice versa
Nashequilibrium • Nash equilibrium does not have to lead allways to the Pareto equilibrium – i.e. „prisoners´dilemma“ • prisoners´dilemma – one-shot non-cooperative game • 2 suspects, 2 strategies: to confess/not to confess • the police offers to each suspect: „if you confess, you will be free, while your complice who did not confess would be jailed for 36 months“
Prisoners´ dilemma Both suspects confess, because if they would not, they would risk 36 months in jail – strategy confess/confess means 24 months in jail for both of them Strategy confess/confess represents the Nash (but not Pareto) equilibrium Pareto equilibrium means the strategy not confess/not confess – the best solution for both suspects, but this strategy will be not chosen, it is too risky Each suspect picks the „lesser evil“
Prisoners´ dilemma – application on price strategy of 2 firms Firms´ profits upon several strategies Coca-cola prefers P=10 if Pepsi prefers P=15 Pepsi prefers P=10 if Coca-Cola prefers P=15 Both firms pick strategy P=10, which represents the Nash (but not Pareto) equilibrium Pareto equilibrium is represented with the strategy P=15/P=15 – if both firms pick strategy P=15, both firms would gain higher profits – but this strategy is too risky
Repeatedgames • firms are allowed to pick strategies repeatedly... • ...according to the strategy of the other firm • tendency to make deals to improve the position of both firms • may lead to the different solutions (unlike the one-shot games) • i.e. to keep/not to keep the cartel treaty
Repeated games Firms´ profits upon several strategies Upon one-shot game both firms pick the strategy not keep/not keepbecause to keep the cartel treaty is too risky Upon repeated games if a specific firm does not keep the treaty, the other firm can re-value its strategy and brake the treaty as well Upon repeated games the result is not sure – keeping the cartel treaty means higher profits for both firms, but still a tendency to brake the treaty...
Nashequilibrimuponthe dominant strategy • specal case of Nash equilibrium • if the specific firm has a dominant strategy, its choice is not influenced by the choice of the other firm, or... • ...firm picks its dominant strategy regardless of the strategy of the other firm
Nash equillibrium upon the dominant strategy Firms pick-out of 2 advertisement expenditures (1 or 2 million of EUR) Pepsi has a dominant strategy to spend 1 million on advertisement because: if Coca-Cola spends 1 or 2 million, Pepsi´s best choice is to spend 1 million anyway If Coca-Cola recognizes the Pepsi´s dominant strategy, it picks the better option, which is: 1 million EUR on advertisement