
Classification and Prediction
E N D
Presentation Transcript
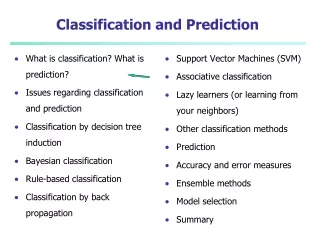
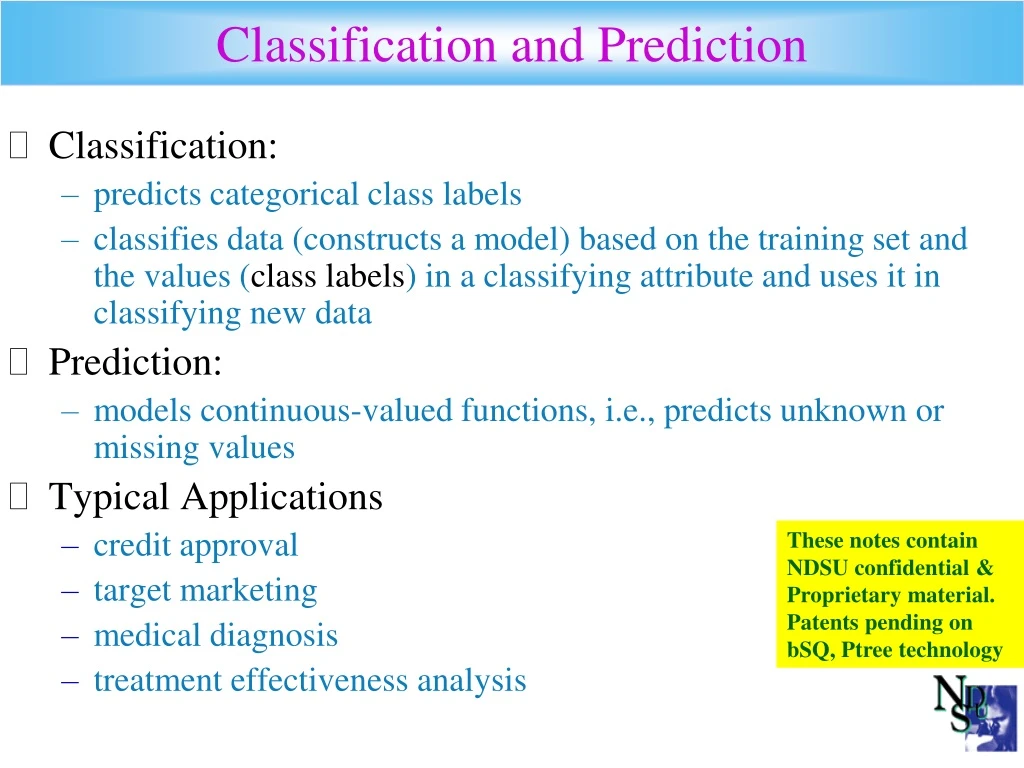
Classification Classification and Prediction • Classification: • predicts categorical class labels • classifies data (constructs a model) based on the training set and the values (class labels) in a classifying attribute and uses it in classifying new data • Prediction: • models continuous-valued functions, i.e., predicts unknown or missing values • Typical Applications • credit approval • target marketing • medical diagnosis • treatment effectiveness analysis These notes contain NDSU confidential & Proprietary material. Patents pending on bSQ, Ptree technology
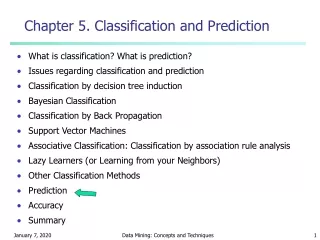
Classification—A Three-Step Process • Model construction: describing a set of predetermined classes • Each tuple/sample is assumed to belong to a predefined class, as determined by the class label attribute • The set of tuples used for model construction: training set • The model is represented as classification rules, decision trees, or math formulae • Model testing: for classifying future or unknown objects • Estimate accuracy of the model • The known label of test samples are compared with the class results produced by the model. • Accuracy rate is the percentage of test set samples that are correctly classified by the model. • Test set is independent of training set, otherwise over-fitting will occur. • Model usage: for classifying future or unknown objects
Classification Process (1): Model Construction Training Data Classifier (Model) Classification Algorithm (creates the Classifer) IF rank = ‘professor’ OR years > 6 THEN tenured = ‘yes’
Test Process (2) (model acceptable if % correct > 60%) Classifier Testing Data % correct classifications? NAME RANK YEARS TENURED Tom Assistant Prof 2 no Correct=3 Incorrect=1 75% Merlisa Associate Prof 7 no George Associate Prof 5 yes Joseph Assistant Prof 7 no Since 75% is above the acceptability threshold, accept the model!
Supervised vs. Unsupervised Learning • Supervised learning (classification) • Supervision: The training data (observations, measurements, etc.) are accompanied by labels indicating the class of the observations • New data is classified based on the training set • Unsupervised learning(clustering) • The class labels of training data is unknown • Given a set of measurements, observations, etc. with the aim of establishing the existence of classes or clusters in the data
Issues regarding classification and prediction (1): Data Preparation • Data cleaning • Preprocess data in order to reduce noise and handle missing values • Relevance analysis (feature selection) • Remove the irrelevant or redundant attributes • Data transformation • Generalize and/or normalize data
classification/prediction issues(2): Evaluating Classification Methods • Predictive accuracy • Speed and scalability • time to construct the model • time to use the model • Robustness • handling noise and missing values • Scalability • efficiency in disk-resident databases • Interpretability: • understanding and insight provded by the model • Goodness of rules • decision tree size • compactness of classification rules
Classification by Decision Tree Induction • Decision tree • A flow-chart-like tree structure • Internal node denotes a test on an attribute • Branch represents an outcome of the test • Leaf nodes represent class labels or class distribution • Decision tree generation consists of two phases • Tree construction • At start, all the training examples are at the root • Partition examples recursively based on selected attributes • Tree pruning • Identify and remove branches that reflect noise or outliers • Use of decision tree: Classifying an unknown sample • Test the attribute values of the sample against the decision tree
Training Dataset This follows an example from Quinlan’s ID3
Output: A Decision Tree for “buys_computer” age? <=30 overcast >40 30..40 student? credit rating? yes no yes fair excellent no yes no yes
Algorithm for Decision Tree Induction • Basic algorithm (a greedy algorithm) • Tree is constructed in a top-down recursive divide-and-conquer manner • At start, all the training examples are at the root • Attributes are categorical (if continuous-valued, they are discretized in advance) • Examples are partitioned recursively based on selected attributes • Test attributes are selected on the basis of a heuristic or statistical measure (e.g., information gain) • Conditions for stopping partitioning • All samples for a given node belong to the same class • There are no remaining attributes for further partitioning – majority voting is employed for classifying the leaf • There are no samples left
Attribute Selection Measure • Information gain (ID3/C4.5) • All attributes are assumed to be categorical • Can be modified for continuous-valued attributes • Gini index(IBM IntelligentMiner) • All attributes are assumed continuous-valued • Assume there exist several possible split values for each attribute • May need other tools, such as clustering, to get the possible split values • Can be modified for categorical attributes
Information Gain (ID3/C4.5) • Select the attribute with the highest information gain • Assume there are two classes, P and N • Let the set of examples S contain p elements of class P and n elements of class N • The amount of information, needed to decide if an arbitrary example in S belongs to P or N is defined as
Information Gain in Decision Tree Induction • Assume that using attribute A, a set S will be partitioned into sets {S1, S2 , …, Sv} • If Si contains piexamples of P and ni examples of N, the entropy, or the expected information needed to classify objects in all subtrees Si is • The encoding information that would be gained by branching on A
Attribute Selection by Information Gain Computation Class P: buys_computer = “yes” Class N: buys_computer = “no” I(p, n) = I(9, 5) =0.940 Compute the entropy for age: Hence Similarly
Gini Index (IBM IntelligentMiner) • If a data set T contains examples from n classes, gini index, gini(T) is defined as where pj = relative frequency of class j in T. • If a data set T is split into two subsets T1 and T2 with sizes N1 and N2 respectively, the gini index of the split data contains examples from n classes, the gini index gini(T) is defined as • The attribute provides the smallest ginisplit(T) is chosen to split the node (need to enumerate all possible splitting points for each attribute).