Download

1 / 37

E N D
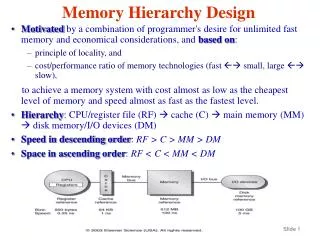
Chapter 2 Memory Hierarchy Design
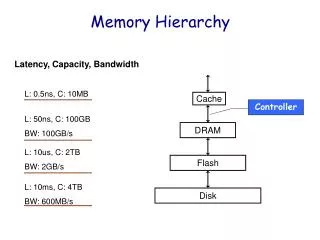
Figure 2.1 The levels in a typical memory hierarchy in a personal mobile device (PMD), such as a cell phone or tablet (A), in a laptop or desktop computer (B), and in a server (C). As we move farther away from the processor, the memory in the level below becomes slower and larger. Note that the time units change by a factor of 109 from picoseconds to milliseconds in the case of magnetic disks and that the size units change by a factor of 1010 from thousands of bytes to tens of terabytes. If we were to add warehouse-sized computers, as opposed to just servers, the capacity scale would increase by three to six orders of magnitude. Solid-state drives (SSDs) composed of Flash are used exclusively in PMDs, and heavily in both laptops and desktops. In many desktops, the primary storage system is SSD, and expansion disks are primarily hard disk drives (HDDs). Likewise, many servers mix SSDs and HDDs.
Figure 2.2 Starting with 1980 performance as a baseline, the gap in performance, measured as the difference in the time between processor memory requests (for a single processor or core) and the latency of a DRAM access, is plotted over time. In mid-2017, AMD, Intel and Nvidia all announced chip sets using versions of HBM technology. Note that the vertical axis must be on a logarithmic scale to record the size of the processor-DRAM performance gap. The memory baseline is 64 KiB DRAM in 1980, with a 1.07 per year performance improvement in latency (see Figure 2.4 on page 88). The processor line assumes a 1.25 improvement per year until 1986, a 1.52 improvement until 2000, a 1.20 improvement between 2000 and 2005, and only small improvements in processor performance (on a per-core basis) between 2005 and 2015. As you can see, until 2010 memory access times in DRAM improved slowly but consistently; since 2010 the improvement in access time has reduced, as compared with the earlier periods, although there have been continued improvements in bandwidth. See Figure 1.1 in Chapter 1 for more information.
Figure 2.3 Internal organization of a DRAM. Modern DRAMs are organized in banks, up to 16 for DDR4. Each bank consists of a series of rows. Sending an ACT (Activate) command opens a bank and a row and loads the row into a row buffer. When the row is in the buffer, it can be transferred by successive column addresses at whatever the width of the DRAM is (typically 4, 8, or 16 bits in DDR4) or by specifying a block transfer and the starting address. The Precharge commend (PRE) closes the bank and row and readies it for a new access. Each command, as well as block transfers, are synchronized with a clock. See the next section discussing SDRAM. The row and column signals are sometimes called RAS and CAS, based on the original names of the signals.
Figure 2.4 Capacity and access times for DDR SDRAMs by year of production. Access time is for a random memory word and assumes a new row must be opened. If the row is in a different bank, we assume the bank is precharged; if the row is not open, then a precharge is required, and the access time is longer. As the number of banks has increased, the ability to hide the precharge time has also increased. DDR4 SDRAMs were initially expected in 2014, but did not begin production until early 2016.
Figure 2.5 Clock rates, bandwidth, and names of DDR DRAMS and DIMMs in 2016. Note the numerical relationship between the columns. The third column is twice the second, and the fourth uses the number from the third column in the name of the DRAM chip. The fifth column is eight times the third column, and a rounded version of this number is used in the name of the DIMM. DDR4 saw significant first use in 2016.
Figure 2.6 Power consumption for a DDR3 SDRAM operating under three conditions: low-power (shutdown) mode, typical system mode (DRAM is active 30% of the time for reads and 15% for writes), and fully active mode, where the DRAM is continuously reading or writing. Reads and writes assume bursts of eight transfers. These data are based on a Micron 1.5V 2GB DDR3-1066, although similar savings occur in DDR4 SDRAMs.
Figure 2.7 Two forms of die stacking. The 2.5D form is available now. 3D stacking is under development and faces heat management challenges due to the CPU.
Figure 2.8 Relative access times generally increase as cache size and associativity are increased. These data come from the CACTI model 6.5 by Tarjan et al. (2005). The data assume typical embedded SRAM technology, a single bank, and 64-byte blocks. The assumptions about cache layout and the complex trade-offs between interconnect delays (that depend on the size of a cache block being accessed) and the cost of tag checks and multiplexing lead to results that are occasionally surprising, such as the lower access time for a 64 KiB with two-way set associativity versus direct mapping. Similarly, the results with eight-way set associativity generate unusual behavior as cache size is increased. Because such observations are highly dependent on technology and detailed design assumptions, tools such as CACTI serve to reduce the search space. These results are relative; nonetheless, they are likely to shift as we move to more recent and denser semiconductor technologies.
Figure 2.9 Energy consumption per read increases as cache size and associativity are increased. As in the previous figure, CACTI is used for the modeling with the same technology parameters. The large penalty for eight-way set associative caches is due to the cost of reading out eight tags and the corresponding data in parallel.
Figure 2.10 Four-way interleaved cache banks using block addressing. Assuming 64 bytes per block, each of these addresses would be multiplied by 64 to get byte addressing.
Figure 2.11 The effectiveness of a nonblocking cache is evaluated by allowing 1, 2, or 64 hits under a cache miss with 9 SPECINT (on the left) and 9 SPECFP (on the right) benchmarks. The data memory system modeled after the Intel i7 consists of a 32 KiB L1 cache with a four-cycle access latency. The L2 cache (shared with instructions) is 256 KiB with a 10-clock cycle access latency. The L3 is 2 MiB and a 36-cycle access latency. All the caches are eight-way set associative and have a 64-byte block size. Allowing one hit under miss reduces the miss penalty by 9% for the integer benchmarks and 12.5% for the floating point. Allowing a second hit improves these results to 10% and 16%, and allowing 64 results in little additional improvement.
Figure 2.12 In this illustration of write merging, the write buffer on top does not use write merging while the write buffer on the bottom does. The four writes are merged into a single buffer entry with write merging; without it, the buffer is full even though three-fourths of each entry is wasted. The buffer has four entries, and each entry holds four 64-bit words. The address for each entry is on the left, with a valid bit (V) indicating whether the next sequential 8 bytes in this entry are occupied. (Without write merging, the words to the right in the upper part of the figure would be used only for instructions that wrote multiple words at the same time.)
Figure 2.13 A snapshot of the three arrays x, y, and z when N = 6 and i = 1. The age of accesses to the array elements is indicated by shade: white means not yet touched, light means older accesses, and dark means newer accesses. The elements of y and z are read repeatedly to calculate new elements of x. The variables i, j, and k are shown along the rows or columns used to access the arrays.
Figure 2.14 The age of accesses to the arrays x, y, and z when B = 3. Note that, in contrast to Figure 2.13, a smaller number of elements is accessed.
Figure 2.15 Speedup because of hardware prefetching on Intel Pentium 4 with hardware prefetching turned on for 2 of 12 SPECint2000 benchmarks and 9 of 14 SPECfp2000 benchmarks. Only the programs that benefit the most from prefetching are shown; prefetching speeds up the missing 15 SPECCPU benchmarks by less than 15% (Boggs et al., 2004).
Figure 2.16 Average hit time latency in clock cycles for the L-H scheme, a currently-impractical scheme using SRAM for the tags, and the alloy cache organization. In the SRAM case, we assume the SRAM is accessible in the same time as L3 and that it is checked before L4 is accessed. The average hit latencies are 43 (alloy cache), 67 (SRAM tags), and 107 (L-H). The 10 SPECCPU2006 benchmarks used here are the most memory-intensive ones; each of them would run twice as fast if L3 were perfect.
Figure 2.17 Performance speedup running the SPECrate benchmark for the LH scheme, an SRAM tag scheme, and an ideal L4 (Ideal); a speedup of 1 indicates no improvement with the L4 cache, and a speedup of 2 would be achievable if L4 were perfect and took no access time. The 10 memory-intensive benchmarks are used with each benchmark run eight times. The accompanying miss prediction scheme is used. The Ideal case assumes that only the 64-byte block requested in L4 needs to be accessed and transferred and that prediction accuracy for L4 is perfect (i.e., all misses are known at zero cost).
Figure 2.18 Summary of 10 advanced cache optimizations showing impact on cache performance, power consumption, and complexity. Although generally a technique helps only one factor, prefetching can reduce misses if done sufficiently early; if not, it can reduce miss penalty. + means that the technique improves the factor, − means it hurts that factor, and blank means it has no impact. The complexity measure is subjective, with 0 being the easiest and 3 being a challenge.
Figure 2.19 The memory hierarchy of the Cortex A53 includes multilevel TLBs and caches. A page map cache keeps track of the location of a physical page for a set of virtual pages; it reduces the L2 TLB miss penalty. The L1 caches are virtually indexed and physically tagged; both the L1 D cache and L2 use a write-back policy defaulting to allocate on write. Replacement policy is LRU approximation in all the caches. Miss penalties to L2 are higher if both a MicroTLB and L1 miss occur. The L2 to main memory bus is 64–128 bits wide, and the miss penalty is larger for the narrow bus.
Figure 2.20 The virtual address, physical and data blocks for the ARM Cortex-A53 caches and TLBs, assuming 32-bit addresses. The top half (A) shows the instruction access; the bottom half (B) shows the data access, including L2. The TLB (instruction or data) is fully associative each with 10 entries, using a 64 KiB page in this example. The L1 I-cache is two-way set associative, with 64-byte blocks and 32 KiB capacity; the L1 D-cache is 32 KiB, four-way set associative, and 64-byte blocks. The L2 TLB is 512 entries and four-way set associative. The L2 cache is 16-way set associative with 64-byte blocks and 128 cKiB to 2 MiB capacity; a 1 MiB L2 is shown. This figure doesn’t show the valid bits and protection bits for the caches and TLB.
Figure 2.21 The data miss rate for ARM with a 32 KiB L1 and the global data miss rate for a 1 MiB L2 using the SPECInt2006 benchmarks are significantly affected by the applications. Applications with larger memory footprints tend to have higher miss rates in both L1 and L2. Note that the L2 rate is the global miss rate that is counting all references, including those that hit in L1. MCF is known as a cache buster.
Figure 2.22 The average memory access penalty per data memory reference coming from L1 and L2 is shown for the A53 processor when running SPECInt2006. Although the miss rates for L1 are significantly higher, the L2 miss penalty, which is more than five times higher, means that the L2 misses can contribute significantly.
Figure 2.23 Characteristics of the i7’s TLB structure, which has separate first-level instruction and data TLBs, both backed by a joint second-level TLB. The first-level TLBs support the standard 4 KiB page size, as well as having a limited number of entries of large 2–4 MiB pages; only 4 KiB pages are supported in the second-level TLB. The i7 has the ability to handle two L2 TLB misses in parallel. See Section L.3 of online Appendix L for more discussion of multilevel TLBs and support for multiple page sizes.
Figure 2.24 Characteristics of the three-level cache hierarchy in the i7. All three caches use write back and a block size of 64 bytes. The L1 and L2 caches are separate for each core, whereas the L3 cache is shared among the cores on a chip and is a total of 2 MiB per core. All three caches are nonblocking and allow multiple outstanding writes. A merging write buffer is used for the L1 cache, which holds data in the event that the line is not present in L1 when it is written. (That is, an L1 write miss does not cause the line to be allocated.) L3 is inclusive of L1 and L2; we explore this property in further detail when we explain multiprocessor caches. Replacement is by a variant on pseudo-LRU; in the case of L3, the block replaced is always the lowest numbered way whose access bit is off. This is not quite random but is easy to compute.
Figure 2.25 The Intel i7 memory hierarchy and the steps in both instruction and data access. We show only reads. Writes are similar, except that misses are handled by simply placing the data in a write buffer, because the L1 cache is not write-allocated.
Figure 2.26 The L1 data cache miss rate for the SPECint2006 benchmarks is shown in two ways relative to the demand L1 reads: one including both demand and prefetch accesses and one including only demand accesses. The i7 separates out L1 misses for a block not present in the cache and L1 misses for a block already outstanding that is being prefetched from L2; we treat the latter group as hits because they would hit in a blocking cache. These data, like the rest in this section, were collected by Professor Lu Peng and PhD student Qun Liu, both of Louisiana State University, based on earlier studies of the Intel Core Duo and other processors (see Peng et al., 2008).
Figure 2.27 The fraction of L2 requests that are prefetches is shown via the columns and the left axis. The right axis and the line shows the prefetch hit rate. These data, like the rest in this section, were collected by Professor Lu Peng and PhD student Qun Liu, both of Louisiana State University, based on earlier studies of the Intel Core Duo and other processors (see Peng et al., 2008).
Figure 2.28 The L2 demand miss rate and prefetch miss rate, both shown relative to all the references to L1, which also includes prefetches, speculative loads that do not complete, and program-generated loads and stores (demand references). These data, like the rest in this section, were collected by Professor Lu Peng and PhD student Qun Liu, both of Louisiana State University.
Figure 2.29 Instruction and data misses per 1000 instructions as cache size varies from 4 KiB to 4096 KiB. Instruction misses for gcc are 30,000–40,000 times larger than for lucas, and, conversely, data misses for lucas are 2–60 times larger than for gcc. The programs gap, gcc, and lucas are from the SPEC2000 benchmark suite.
Figure 2.30 Instruction misses per 1000 references for five inputs to the perl benchmark in SPEC2000. There is little variation in misses and little difference between the five inputs for the first 1.9 billion instructions. Running to completion shows how misses vary over the life of the program and how they depend on the input. The top graph shows the running average misses for the first 1.9 billion instructions, which starts at about 2.5 and ends at about 4.7 misses per 1000 references for all five inputs. The bottom graph shows the running average misses to run to completion, which takes 16–41 billion instructions depending on the input. After the first 1.9 billion instructions, the misses per 1000 references vary from 2.4 to 7.9 depending on the input. The simulations were for the Alpha processor using separate L1 caches for instructions and data, each being two-way 64 KiB with LRU, and a unified 1 MiB direct-mapped L2 cache.
Figure 2.31 Summary of 18 80x86 instructions that cause problems for virtualization (Robin and Irvine, 2000). The first five instructions of the top group allow a program in user mode to read a control register, such as a descriptor table register without causing a trap. The pop flags instruction modifies a control register with sensitive information but fails silently when in user mode. The protection checking of the segmented architecture of the 80x86 is the downfall of the bottom group because each of these instructions checks the privilege level implicitly as part of instruction execution when reading a control register. The checking assumes that the OS must be at the highest privilege level, which is not the case for guest VMs. Only the MOVE to segment register tries to modify control state, and protection checking foils it as well.
Figure 2.35 Early performance of various system calls under native execution, pure virtualization, and paravirtualization.