Data Inputting and Analysis Using SPSS: A Guide to Likert Scale and Statistical Methods
This comprehensive guide covers the stages of data inputting, preparation, coding, presentation, and tabulation using SPSS, with a specific focus on applying the Likert scale. It details the importance of data editing, error checking, and coding for proper data analysis. The text explains the definitions and methods of descriptive statistics, including univariate, bivariate, and multivariate statistics, as well as key concepts such as kurtosis and skewness. The guide aims to ensure accurate data handling for efficient data-driven decision making.

Data Inputting and Analysis Using SPSS: A Guide to Likert Scale and Statistical Methods
E N D
Presentation Transcript
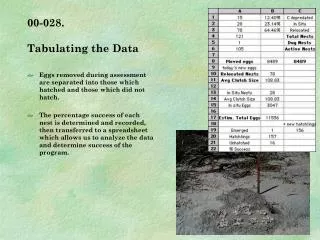
Data Inputting, Preparing, Codding, Presenting, and Tabulating
Raw data may not be in a form that lends itself well to analysis. Raw data are recorded just as the respondent indicated. For an oral response, the raw data are in the words of the respondent, whereas for a questionnaire response, the actual number checked is the number stored. Raw data will often also contain errors both in the form of respondent errors and non-respondent errors. Whereas a respondent error is a mistake made by the respondent, a non-respondent error is a mistake made by an interviewer or by a person responsible for creating an electronic data file representing the responses.
Data Editing The process of checking the completeness, consistency(tutarlılık)and legibility(açıklık)of data and making the data ready for coding and transfer to storage. Compare these two questions: How old are you? 52 Years How many years have you been married?43 Years Comment: It is impossible, so one of these answers are incorrect.
field editing Preliminary editing by a field supervisor on the same day as the interview to catch technical omissions, check legibility of handwriting, and clarify responses that are logically or conceptually inconsistent. in-house editing A careful editing job performed by a centralized office staff.
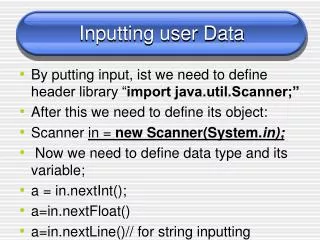
■ Editing Technology Today, computer routines can check for inconsistencies automatically. Thus, for electronic questionnaires, rules can be entered which prevent inconsistent responses from ever being stored in the file used for data analysis. These rules should represent the conservative judgment of a trained data analyst. Some online survey services can assist in providing this service. Show a likert example in SPSS
Data Coding Is the assignment of numerical scores or classifying symbols to previously edited data. Careful editing makes the coding job easier. Codes are meant to represent the meaning in the data. Assigning numerical symbols permits the transfer of data from questionnaires or interview forms to a computer. Codes often, are numerical symbols. However, they are more broadly defined as rules for interpreting, classifying, and recording data. In qualitative research, numbers are seldom used for codes.
Pre-codingFixed-Alternative Questions When a questionnaire is highly structured, the categories may be pre-coded before the data are collected. This coding is useful when inputting data into SPSS.
Error Checking The final stage in the coding process is error checking and verification, or data cleaning, to ensure that all codes are legitimate. For example, if “sex” is coded 1 for “male” and 2 for “female” and a 3 code is found, a mistake obviously has occurred and an adjustment must be made.
Female Male Wrong Jobless Staff Worker
Descriptive statistics Univariate Statistics Statistical Methods Bivariate Statistics Multivariate Statistics
Means Standard Deviation & Varians Kurtosis & Skewnsess Descriptive statistics Variation Coefficient Cross Tabulation and Percentages
Kurtosis is any measure of the "peakedness" of the probability distribution of a real-valued random variable. kurtosisis a descriptor of the shape of a probability distribution There are various interpretations of kurtosis, and of how particular measures should be interpreted; these are primarily peakedness (width of peak), tail weight, and lack of shoulders (distribution primarily peak and tails, not in between).
Kurtosis is a measure of whether the data are peaked or flat relative to a normal distribution. That is, data sets with high kurtosis tend to have a distinct peak near the mean, decline rather rapidly, and have heavy tails. Data sets with low kurtosis tend to have a flat top near the mean rather than a sharp peak. A uniform distribution would be the extreme case.
Positive Peaked Distribution Negatıve flat Distribution
The Skewness For a normal distribution is zero, and any symmetric data should have a skewness near zero. Negative values for the skewness indicate data that are skewed left and positive values for the skewness indicate data that are skewed right. By skewed left, we mean that the left tail is long relative to the right tail. Similarly, skewed right means that the right tail is long relative to the left tail. Some measurements have a lower bound and are skewed right. For example, in reliability studies, failure times cannot be negative.
Positive right skewed Negative left skewed