Normalization for cDNA Microarray Data
This study focuses on the critical normalization issues encountered in cDNA microarray data analysis, specifically addressing both within-slide and between-slide normalization techniques. Key topics include the selection of reference genes, balance of dye intensities, and the impact of varying experimental conditions. The work emphasizes the importance of using constant genes, spike-in controls, and genomic titration for robust normalization. Various statistical methods, including lowess normalization and median adjustment, are discussed to ensure accurate results across multiple experimental slides.


Normalization for cDNA Microarray Data
E N D
Presentation Transcript
Normalization for cDNA Microarray Data Yee Hwa Yang, Sandrine Dudoit, Percy Luu and Terry Speed. SPIE BIOS 2001, San Jose, CA January 22, 2001
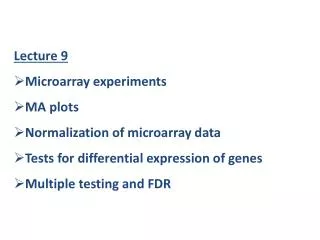
Normalization issues Within-slide • What genes to use • Location • Scale Paired-slides (dye swap) • Self-normalization Between slides
Within-Slide Normalization • Normalization balances red and green intensities. • Imbalances can be caused by • Different incorporation of dyes • Different amounts of mRNA • Different scanning parameters • In practice, we usually need to increase the red intensity a bit to balance the green
Methods? log2R/G -> log2R/G - c = log2R/ (kG) Standard Practice (in most software) c is a constant such that normalized log-ratios have zero mean or median. Our Preference: c is a function of overall spot intensity and print-tip-group. What genes to use? • All genes on the array • Constantly expressed genes (house keeping) • Controls • Spiked controls (e.g. plant genes) • Genomic DNA titration series • Other set of genes
Experiment mRNA samples R = Apo A1 KO mouse liver G = Control mouse liver (All C57Bl/6) KO #8 Probes: ~6,000 cDNAs, including 200 related to lipid metabolism.
M vs. A M = log2(R / G) A = log2(R*G) / 2
Normalization - Median • Assumption: Changes roughly symmetric • First panel: smooth density of log2G and log2R. • Second panel: M vs. A plot with median set to zero
Normalization - lowess • Global lowess • Assumption: changes roughly symmetric at all intensities.
Normalisation - print-tip-group Assumption:For every print group, changes roughly symmetric at all intensities.
Effects of Location Normalisation Before normalisation After print-tip-group normalisation
Within print-tip-group box plots forprint-tip-group normalized M
Taking scale into account Assumptions: • All print-tip-groups have the same spread. True ratio is mij where i represents different print-tip-groups, j represents different spots. Observed is Mij, where Mij = aimij Robust estimate of ai is MADi = medianj { |yij - median(yij) | }
Follow-up Experiment • 50 distinct clones with largest absolute t-statistics from the first experiment. • 72 other clones. • Spot each clone 8 times . • Two hybridizations: Slide 1, ttt -> redctl-> green. Slide 2, ttt -> greenctl->red.
Paired-slides: dye swap • Slide 1, M = log2 (R/G) - c • Slide 2, M’ = log2 (R’/G’) - c’ Combine bysubtract the normalized log-ratios: [ (log2 (R/G) - c) - (log2 (R’/G’) - c’) ] / 2 [ log2 (R/G) + (log2 (G’/R’) ] / 2 [ log2 (RG’/GR’) ] / 2 provided c = c’ Assumption: the separate normalizations are the same.
Result of Self-Normalization Plot of (M - M’)/2 vs. (A + A’)/2
Summary Case 1: A few genes that are likely to change Within-slide: • Location: print-tip-group lowess normalization. • Scale: for all print-tip-groups, adjust MAD to equal the geometric mean for MAD for all print-tip-groups. Between slides (experiments) : • An extension of within-slide scale normalization (future work). Case 2: Many genes changing (paired-slides) • Self-normalization: taking the difference of the two log-ratios. • Check using controls or known information.
http://www.stat.berkeley.edu/users/terry/zarray/Html/ Technical Reports from Terry’s group: http://www.stat.Berkeley.EDU/users/terry/zarray/Html /papersindex.html • Comparison of Discrimination Methods for the Classification of Tumors Using Gene Expression Data • Statistical methods for identifying differentially expressed genes in replicated cDNA microarray experiments. • Comparison of methods for image analysis on cDNA microarray data. • Normalization for cDNA Microarray Data Statistical software R http://lib.stat.cmu.edu/R/CRAN/
Terry Speed Sandrine Dudoit Natalie Roberts Ben Bolstad Matt Callow (LBL) John Ngai’s Lab (UCB) Percy Luu Dave Lin Vivian Pang Elva Diaz Acknowledgments