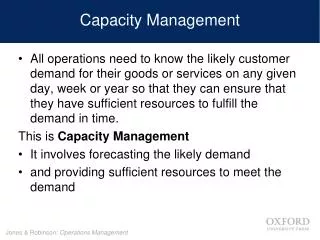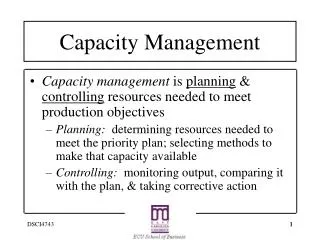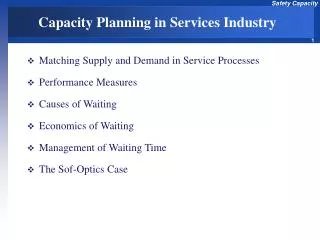
Capacity Management in Services Module
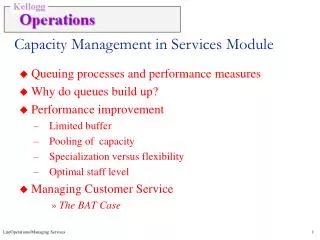
Capacity Management in Services Module. Queuing processes and performance measures Why do queues build up? Performance improvement Limited buffer Pooling of capacity Specialization versus flexibility Optimal staff level Managing Customer Service The BAT Case. Telemarketing at L.L.Bean.

Capacity Management in Services Module
E N D
Presentation Transcript
Capacity Management in Services Module • Queuing processes and performance measures • Why do queues build up? • Performance improvement • Limited buffer • Pooling of capacity • Specialization versus flexibility • Optimal staff level • Managing Customer Service • The BAT Case Lin/Operations/Managing Services
Telemarketing at L.L.Bean • During some half hours, 80% of calls dialed received a busy signal. • Customers getting through had to wait on average 10 minutes for an available agent. Extra telephone expense per day for waiting was $25,000. • For calls abandoned because of long delays, L.L.Bean still paid for the queue time connect charges. • In 1988, L.L.Bean conservatively estimated that it lost $10 million of profit because of sub-optimal allocation of telemarketing resources. Lin/Operations/Managing Services
What determines Service Quality? Lin/Operations/Managing Services
Queuing Systems to model Service Processes: A Simple Process Order Queue “buffer” size K Sales Reps processing calls Incoming calls Answered Calls Calls on Hold MBPF Inc. Call Center Blocked Calls (Busy signal) Abandoned Calls (Tired of waiting) Lin/Operations/Managing Services
Performance Measures • Revenue Related • Throughput R • Abandonment Ra • Probability of blocking Rb • Cost Related • Server utilization r • Inventory/WIP : # in queue Ii /system I • Customer Service related • Waiting/Flow Time: time spent in queue Ti /system T Lin/Operations/Managing Services
Call # 10 9 8 7 6 5 4 3 2 1 0 0 20 40 60 80 1 0 0 TIME Inventory (# of calls in system) 5 4 3 2 1 0 0 20 40 60 80 1 0 0 TIME Why do queues form? • variability: • arrival times • service times • processor availability • utilization: • Impact of variability increases as utilization increases! (throughput or capacity ) Lin/Operations/Managing Services
Actual Average Flow Variability Time, T Theoretical Tp Flow Time r 100% Utilization mean service time utilization effect variability effect x x Queuing Theory: Variability + Utilization = Waiting • Throughput-Delay curve: • PK Formula for average wait in queue: Lin/Operations/Managing Services
Levers to reduce waiting and increase QoS: variability reduction + safety capacity • How reduce system variability? • Safety Capacity = capacity carried in excess of expected demand to cover for system variability • it provides a safety net against higher than expected arrivals or services and reduces waiting time Lin/Operations/Managing Services
Example: MBPF Calling Center one server, unlimited buffer • Consider MBPF Inc. that has a customer service representative (CSR) taking calls. When the CSR is busy, the caller is put on hold. The calls are taken in the order received. • Assume that calls arrive exponentially at the rate of one every 3 minutes. The CSR takes on average 2.5 minutes to complete the reservation. The time for service is also assumed to be exponentially distributed. • The CSR is paid $20 per hour. It has been estimated that each minute that a customer spends in queue costs MBPF $2 due to customer dissatisfaction and loss of future business. • MBPF’s waiting cost = Lin/Operations/Managing Services
Limited Buffer Size • In reality only a limited number of people can be put on hold (this depends on the phone system in place) after which a caller receives busy signal. Assume that at most 5 people can be put on hold. Any caller receiving a busy signal simply calls a competitor resulting in a loss of $100 in revenue. • # of servers c = • buffer size K = • What is the hourly loss because of callers not being able to get through? Lin/Operations/Managing Services
50% Queue Server 50% Queue Server Queue Servers Resource Pooling • 2 phone numbers • MBPF hires a second CSR who is assigned a new telephone number. Customers are now free to call either of the two numbers. Once they are put on hold customers tend to stay on line since the other may be worse.. • 1 phone number: pooling • both CSRs share the same telephone number and the customers on hold are in a single queue Lin/Operations/Managing Services
Queue Server Queue Server Queue Servers Specialization Vs. Flexibility • Specialization • Service divided into two segments (one server at each segment), each averaging 5 minutes • Flexibility • Second server added, with each server performing entire service Lin/Operations/Managing Services
Staffing Decision • Assume that the MBPF call center has a total of 6 lines. With all other data as in Example 2, what is the optimal number of CSRs that MBPF should staff the call center with? Lin/Operations/Managing Services
Determining the Optimal Staff Level Lin/Operations/Managing Services
The BAT Case Lin/Operations/Managing Services
Levers for Reducing Flow Time • “is to decrease the work content of (only ?) critical activities”, • and/or move it to non critical activities. • Reduce waiting time: • reduce variability • arrivals & service requests • synchronize flows within the process • increase safety capacity • lower utilization • Pooling • Match resource availability with flows in and out of process Lin/Operations/Managing Services
Framework for Process Flow Management Flow Chart Process Identify Bottlenecks Maximal Flow Rate Identify Critical Path Minimal Flow Time mean Macro Average Performance Process Re-Design No Competitive? Demand Pattern Yes Demand & Supply Mgt +Process redesign Micro Variability Performance No Competitive? variability Continuous Improvement Yes Lin/Operations/Managing Services
Learning objectives:General Service Process Management • Queues build up due to variability. • Reducing variability improves performance. • If service cannot be provided from stock, safety capacity must be provided to cover for variability. • Tradeoff is between cost of waiting, lost sales, and cost of capacity. • Improving Performance • Reduce variability • Increase safety capacity • Pooling servers/capacity • Increase synchronization between demand (arrivals) and service • Manage demand • Synchronize supply: resource availability Lin/Operations/Managing Services