Analyzing and Graphing Polynomial Functions for Maximum and Minimum Points
Evaluate f(2) and f(-2) of polynomial functions to locate real zeros, identify relative maxima and minima, understand end behavior, create tables of values, and graph with smooth curves. Learn to identify turning points and predict the presence of maxima and minima.

Analyzing and Graphing Polynomial Functions for Maximum and Minimum Points
E N D
Presentation Transcript
Do Now 3/6/2012 • Evaluate f(2) and f(-2): • f(x) = x3 – x2 – 4x + 4
Today’s Objective: • Graph polynomial functions and locate real zeros • Find the relative maxima and minima of polynomial functions
Vocabulary • Location Principle- • if f(a)< 0 and f(b) > 0, then there exists at least one zero between a and b • Relative maximum- a point on the graph of a function where no other nearby points have a greater y-coordinate • Relative minimum- a point on the graph of a function where no other nearby points have a lesser y-coordinate
Analyzing Graphs of polynomial functions • Graphing polynomial functions • Identify the end behavior • Create a table of values • Graph and connect points through smooth curves • Analyzing • Locate zeros of a Function • Identify maximum and minimum points • Explain turning points and make predictions
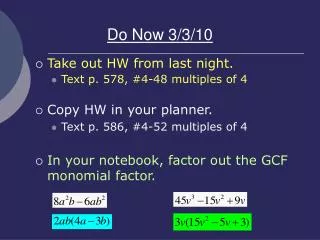
Graphing polynomial functions • Create a table of values • f(x) = x3 – 5x2 + 3x + 2 • Identify maximum number of zeros possible • Plug in x values to find f(x) • Extend table until you reach the maximum change in signs
Graph coordinates • Connect points with smooth curves • Remember this is a sketch it does not have to be perfect
Graph a Polynomial Function Graph f(x) = –x3 – 4x2 + 5 by making a table of values. Answer:
Do Now • What is a relative minimum and maximum?
Relative Minima and Maxima • In order to find: • Create an xy-table • Look at y values for increase and decrease in 3 consecutive values • If values increase and decrease between 3 consecutive numbers then there exist a relative maximum • If values decrease then increase there exist a relative minimum.
Analyzing Polynomial functions • Create a table of values • Identify number of zeros • Identify relative maximum and minimum points • Explain turning points and make predictions
Maximum and Minimum Points Graph f(x) = x3 – 4x2 + 5. Estimate the x-coordinates at which the relative maxima and minima occur. Make a table of values and graph the function.