
Understanding Functions: Increasing, Decreasing, and Extrema Analysis
This lesson focuses on determining the end behavior of functions, identifying intervals where functions are increasing, decreasing, or constant, and discovering their maxima and minima. Scholars will learn to analyze the average rate of change of a function and use specific examples to visualize these concepts through graphs and tables. Critical points where functions change behavior, known as extrema, will also be explored. By engaging with this material, learners will gain a comprehensive understanding of function behavior and its graphical representations.

Understanding Functions: Increasing, Decreasing, and Extrema Analysis
E N D
Presentation Transcript
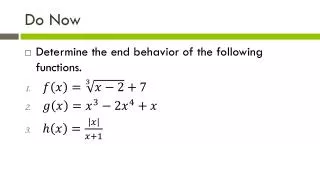
Do Now • Determine the end behavior of the following functions.
Objectives • 24.September.2012 • Scholars will be able to… • Determine intervals on which functions are increasing, constant, or decreasing, and determine maxima and minima of functions. • Determine the average rate of change of a function.
Increasing and Decreasing • On an open interval for a function : • If for every and such that , then , is increasing. • If for every and such that , then , is decreasing. • If for every and such that , then , is constant.
Example • Graph it what does it look like? • Use a table. • Decreasing on the interval • This refers to the -axis
Example • Graph it what does it look like? • Use a table. • Increasing on the interval • Decreasing on the interval • Increasing on the interval • What is the function doing at and ?
In Pears • Answer the question: • How do we estimate the location of the real -intercepts (zeroes) of a continuous function? • Why is this true?
Extrema • Extremaare the critical points of a function at which a function change its increasing or decreasing behavior. • Extrema is the plural of extremum (Latin for extreme.) • 1 maximum. • 2 maxima. • 1 minimum. • 2 minima.
Relative Extrema • For a function on an open interval . • is a relative maximum of if • is a relative minimum of if
Average Rate of Change • The average rate of change of a function on the closed interval is the slope of the secant line between those two points. • Positive average rates of change mean the graph increases on average over that interval. • Negative… I bet you can figure that one out.
Example • Find the average rate of change between of
Exit Ticket • Given the function , which of the following intervals has the smallest average rate of change?


