Our Shared Seas: Ocean Conservation Data Hub
70 likes | 147 Vues
Our Shared Seas platform aggregates authoritative ocean conservation data for stakeholders making informed decisions. Explore trends, threats, and solutions in a user-friendly format. Visit www.OurSharedSeas.com for more insights.

Our Shared Seas: Ocean Conservation Data Hub
E N D
Presentation Transcript
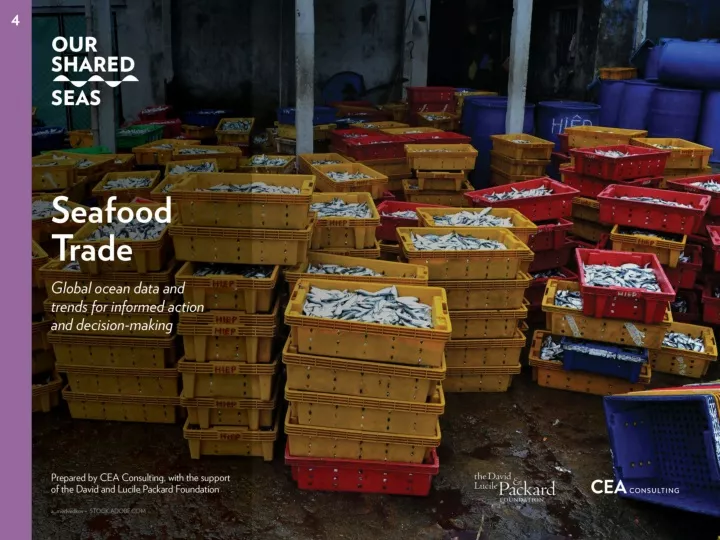
While it is often said that the world is awash in data, informed decision-making can occur only when data are transparent and readily available to the stakeholders that need the information. Our Shared Seas is a website platform which seeks to roll up relevant ocean conservation data in a centralized, easy-to-use platform, providing authoritative data and sensemaking of ocean trends. • The purpose of this project is to aggregate ocean statistics and trends to support the marine conservation community—including funders, advocates, practitioners, and policymakers—in making better, faster, and more informed decisions. In 2017, the David and Lucile Packard Foundation commissioned CEA Consulting to prepare Our Shared Seas: A 2017 Overview of Ocean Threats and Conservation Funding as a primer on the primary ocean threats, trends, and solutions. As a second edition of the original narrative report, the 2019 edition takes the form of a website is which provides updated figures and share key data points in a format that is easy to digest and use for external purposes. • Visitors are welcome to download both individual charts directly from the site and PowerPoint decks for external use, provided that corresponding references are cited. • This deck serves as a companion piece to the Our Shared Seas website. Readers are encouraged to visit the website for additional data and analysis at www.OurSharedSeas.com.
Seafood Trade: Global Overview Seafood accounts for roughly 10 percent of the traded value of global agricultural products. China has been the largest exporter of seafood since 2002. Other leading seafood exporters include Norway (primarily salmonid aquaculture as well as wild cod, herring, mackerel, and various whitefish and small pelagics) and Vietnam (driven by farmed catfish, shrimp, and trade of processed and re-exported products). Top ten exporters of fish and fish products, by value (2006 vs. 2016) Sources: FAO, ed., The State of World Fisheries and Aquaculture 2018, Rome, 2018; Chatham House, ‘resourcetrade.earth,’ 2018. Accessed November 5, 2018. http://resourcetrade.earth.
Seafood Trade: Global Overview The United States, Japan, and the European Union collectively accounted for 64 percent of the total value of seafood imports in 2016. While China is the largest seafood importer by volume, it is the third largest importer by value, partly due to its practice of importing raw material, processing it, and exporting value-added products. Top ten exporters of fish and fish products, by value (2006 vs. 2016) Sources: FAO, ed., The State of World Fisheries and Aquaculture 2018, Rome, 2018;
Seafood Trade: Global Overview An important trend in global seafood trade has been the faster growth rate in exports from developing countries, as compared to developed countries in recent decades. In 2016, exports from developing countries accounted for roughly 54 percent of the value and 59% of the volume of global seafood exports. Top five seafood trade flows, by value (2016) Sources: FAO, ed., The State of World Fisheries and Aquaculture 2018, Rome, 2018;
Seafood Trade: Global Overview There are a variety of trends driving seafood trade among the fastest growing trade flows. Farmed shrimp exported to Vietnam for processing is driving the flow between Ecuador and Vietnam. The flow between China and Thailand is driven by tuna exported to Thailand for processing. Trade from India to both Vietnam and the United States is primarily based on increased production of farmed shrimp in India. Growth rate of fastest growing seafood trade flows (2011-2016) Sources: FAO, ed., The State of World Fisheries and Aquaculture 2018, Rome, 2018;
The David and Lucile Packard Foundation is a private family foundation created in 1964 by David Packard (1912–1996), cofounder of the Hewlett-Packard Company, and Lucile Salter Packard (1914–1987). The Foundation provides grants to nonprofit organizations in the following program areas: Conservation and Science; Population and Reproductive Health; Children, Families, and Communities; and Local Grantmaking. The Foundation makes national and international grants and also has a special focus on the Northern California counties of San Benito, San Mateo, Santa Clara, Santa Cruz and Monterey. Today, the Packard Foundation’s ocean investments are focused in six countries and on a suite of global strategies that together offer great potential for accelerating positive change. Learn more at www.packard.org. Since 1984, California Environmental Associates (CEA) has supported the work of environmental foundations and nonprofits as well as sustainability-oriented businesses with in-depth research and analysis, program design and evaluation, and strategic planning. Learn more at www.ceaconsulting.com. Please use the following citation when referencing this project as a body of work: CEA Consulting. 2019. “Our Shared Seas: Global ocean data and trends for informed action and decision-making.”