Understanding Functions: Concepts, Graphs, and Evaluations
This guide covers the basics of functions and their graphs, focusing on key concepts such as the domains and ranges, determining if a relation is a function, and the vertical line test. Students will learn how to graph equations in two variables and evaluate functions using specific input values. Practical examples illustrate how to check for linearity and perform arithmetic operations on functions. A comprehensive approach to functional concepts ensures a solid understanding of this fundamental topic.

Understanding Functions: Concepts, Graphs, and Evaluations
E N D
Presentation Transcript
2 – 1: Functions and Their Graphs Objective: Ca 24: Students solve problems involving functional concepts such as composition, and performing arithmetic operations on functions.
A relation is a mapping or pairing of input values with output values. The set of input values is the domain. (x – values) The set of output values is the range. (y – values)
A relation is a function if and only if there is exactly one output value for each input value.
Example 1: Identify the domain and range. Then tell if the relation is a function.
The domain is {-3, 1, 4}. The range is {3, -2, -1, 4}. This relation is not a function because the input 1 has two outputs –2 and 1.
EXAMPLE 2: Domain = {-1, 1, 3, 4}. Range = {3, 1, -2}.
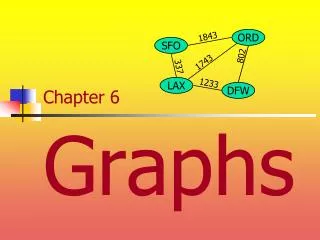
Vertical Line Test A relation is a function if and only if no vertical line intersects the graph of the relation at more than one point.
Example 3: Determine if the graph of a relation is a function. Yes: a function
Graphing and Evaluating Functions Many functions can be represented by an equation in two variables such as y = 2x + 7
An ordered pair (x, y) is a solution of such an equation if the equation is true when the values of x and y are substituted into the equation.
In an equation the input variable is called the independent (x) variable. The output variable is called the dependent (y) variable.
Graphing Equations in Two Variables To graph an equation in two variables follow these steps. 1. Construct a table of values. 2. Graph enough points to recognize a pattern. 3. Connect the points with a smooth curve.
Example 4: Graph the function y = x + 1 Step 1: Construct a table of values
Linear Functions The function y = x + 1 is a linear function because it is of the form y = mx + b Where m and b are constants. The graph of any linear function is a line. By naming a function f you can write the function using function notation.
The symbol f(x) is read as “the value of f at “x” or simply “f of x”. f is another name for y. The domain of a function consists of all values of x for which the function is defined. The range of a function consists of all values of f(x) where x is in the domain of ‘f’.
Functions do not have to be named ‘f’ other letters may used, such as ‘g’, and ‘h’.
Example 5: Evaluating Functions. Decide whether the function is linear. Then evaluate the function when x = -2 Is not a linear equation because it has an x2 term.
Is linear because it is a first degree polynomial and is of the form y = mx +b