2009 PFC Meeting
2009 PFC Meeting. Two-phase CFD Analysis of ITER FW Hypervapotrons. D.L. Youchison, M.A. Ulrickson, J.H. Bullock Sandia National Laboratories. Boston, MA July 9, 2009.

2009 PFC Meeting
E N D
Presentation Transcript
2009 PFC Meeting Two-phase CFD Analysis of ITER FW Hypervapotrons D.L. Youchison, M.A. Ulrickson, J.H. Bullock Sandia National Laboratories Boston, MA July 9, 2009 Sandia is a multiprogram laboratory operated by Sandia Corporation, a Lockheed Martin Company,for the United States Department of Energy’s National Nuclear Security Administration under contract DE-AC04-94AL85000. 1
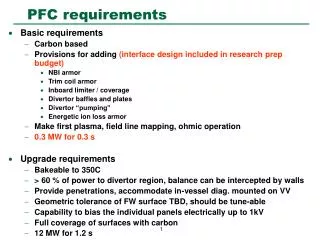
SS Back Plate CuCrZr Heat Sink Be Tiles First Wall Panel Outline • ITER Baseline FW Design using Hypervapotrons • CFD Analysis using Fluent • CFD Analysis using Star-CCM+ • Conclusions 2
ITER Baseline FW Design The ITER first wall baseline design recently changed to accommodate larger heat fluxes anticipated from edge-localized modes and disruptions. The nominal first wall heat flux is 0.5 MW/m2. However, heat fluxes as high as 5 MW/m2 occur on relatively small areas scattered about the first wall. To handle these situations, hypervapotrons are incorporated into the first wall at select locations. Under these heat loads nucleate boiling may occur over a limited portion of the hypervapotron. 3
ITER First Wall 04 Baseline Design 40 toroidal fingers comprised of rectangular channels or hypervapotrons 4
g Hypervapotron Finger The hypervapotron heat sink in this analysis consists of a copper alloy faceplate, CuCrZr (Elbrodur G) with machined teeth or fins transverse to the flow direction. The total mock-up length is 693 mm, and the width is 48 mm. The area exposed to the highest heat loads is 50 mm x 48 mm. The strongback under the hypervapotron channel is 56 mm thick and is comprised of 316 LN stainless steel. The teeth height is 2 mm and the groove and teeth width are 3 mm. Two slots, 2-mm-wide, run the length of the hypervapotron channel and detach the teeth from the channel sidewalls. The open channel under the teeth is 8 mm deep by 42 mm wide. q” OUT IN 5
Why hypervapotrons? • Advantages: • High CHF with relatively lower pressure drop • Reduction in E&M loads due to thin copper faceplate • Lower Cu/Be interface temperature (no ss liners) • Less bowing of fingers due to thermal loads • Disadvantages: • CuCrZr/SS316LN UHV joint exposed to water 6
Understanding two-phase flows in hypervapotrons requires a three-prong approach. • HV CFD modeling w/ conjugate heat transfer • velocity & temp. distributions • HV Flow visualization • validate bubble transport & vapor fraction • HV HHF testing • validate thermal response (Tsurf & DT) Two CFD codes, Fluent and Star-CCM+ were used to model the thermal performance of hypervapotron fingers subjected to localized heat loads. The Eulerian multiphase model used in Star-CCM+ produced good results on void fraction and heat transfer. This may be the first time that the RPI model for forced convection nucleate boiling was used in Star-CCM+ on complex 3-d geometries under one-sided heating. 7
Two-phase CFD in water-cooled PFCs • Problem: conjugate heat transfer with boiling • (an engineering science research project) • • Focus on nucleate boiling regime below critical • heat flux • • Use Eulerian multiphase model in FLUENT & Star-CCM+ • • RPI model implemented through UDF’s in FLUENT • 6.3 by Andrey Troshko, Fluent Inc. (Bergles&Rohsenow) • • Features heat and mass transfer between liquid • and vapor, custom drag law, lift or buoyancy and influence of bubbles on turbulence • Difficult to converge for rapid boiling • Influence of high flow rates (forced convection)? 8
Fluent • Boiling model development • Based on Eulerian multiphase model • Continuous liquid and dispersed bubbles • Thermodynamic VLE (Vapor Liquid Equilibrium) model to calculate mass transfer rate for each species • Source term for continuity equations (inter-phase mass transfer) • Source terms for enthalpy equation to account for latent heat effect • Source term for momentum equations • Shear-dependent bubble sizes (Jameson 1993) • Implemented in FLUENT 6 via UDF Fluent UDFs Schiller-Naumann RPI Wall q” partioning Unal Ranz-Marshall 9
5 MW/m2 400 g/s t=2.05s Velocity distributions 2mm teeth depth and 3-mm spacing optimized to produce a simple reverse eddy in the groove. Drag on bubbles, lift or buoyancy, viscosity changes and geometry affect velocity distribution under heated zone. 11
Temperature Distributions (transient) Temperature distributions evolve with time and vapor generation. Fluid/solid interface Heated surface 12
Vapor Fraction Vapor forms in grooves eventually condensing into flow at the top of the teeth. Higher density vapor volume in bottom of groove moves to side slot due to buoyancy forces. Vapor fraction less than 1% may be too low compared to Star-CCM+. Vapor distribution not yet at equilibrium at t=2.05 s. Longer simulation times are required, but Fluent often diverges during rapid boiling. 13
Fluent Heat Transfer Coefficients Heat transfer coefficients increase in grooves where boiling takes place ranging from 12,000 to 13,000 W/m2K. 14
Star-CCM+ 559,000 cell polyhedra mesh Star-CCM+ 15
Used temperature dependent material properties. Kth of CuCrZr 17
Star-CCM+ gives same h as Fluent. Heat transfer coefficients increase in grooves where boiling takes place ranging from 12,000 to 13,000 W/m2K. 19
With no boiling, highest HX is under teeth, not in grooves. t=6.3 s 20
Iso-surface of 2% vapor volume fraction t=6.3 s volume mixture 22
Conclusions Two commercial CFD codes, Fluent and Star-CCM+, modeled two-phase heat transfer for a first wall hypervapotron finger. The results indicate that a heat flux of 5 MW/m2 can be accommodated over a 50-mm-long portion of the heated length. Fluent did not fully converge. The converged Star-CCM+ simulation produced a maximum surface temperature of 415 oC and an average vapor volume fraction of 6% localized in the hypervapotron grooves under the heated area. If 10-mm-thick Be tiles were included, vaporization of Be would be an issue. The modeling included bubble entrainment in the bulk flow, mixing and condensation. The analysis demonstrated the efficacy of side slots not only in cooling the corner at the sidewall, but also in removing trapped vapor from the grooves. Although the simulations reach bulk flow equilibrium in about 2 seconds, the vapor fraction and resultant thermal response requires longer simulation times (~6 s) to equilibrate. • caution: experimental validation required! …to begin soon. 23