Download
1 / 38
380 likes | 569 Vues
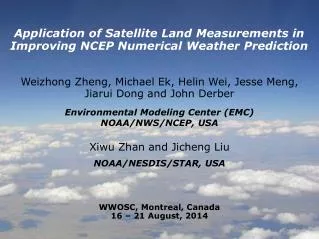
Land and Hydrology modeling in NCEP Weather and Climate Prediction Models. Ken Mitchell. Environmental Modeling Center National Centers for Environmental Prediction. NOAA Science Advisory Board November 6, 2001. NCEP : Where America's Climate and Weather Services Begin.

E N D
Land and Hydrology modeling in NCEP Weather and Climate Prediction Models Ken Mitchell Environmental Modeling Center National Centers for Environmental Prediction NOAA Science Advisory Board November 6, 2001 NCEP: Where America's Climate and Weather Services Begin
OVERARCHING THEMES • Linkages between weather, water, and climate predictions • Multiple disciplines of meteorology, hydrology, oceanography • Dynamical model predictions at multiple time and space scales • Fundamental importance of vast computer power • Ensemble prediction and probabilistic forecasts • An emerging community modeling approach • Central role of data assimilation for atmosphere, land, ocean • Partnerships to infuse science and technology into operations
NCEP Dynamical Model Prediction Suite 1 - Ocean seasonal forecast model: coupled ocean/atmosphere -- predict tropical Pacific SST (issued monthlyout to 11 months) -- GFDL MOM ocean model (order 50-150 km resolution) 2 - Atmospheric seasonal forecast model (SFM): coupled atmosphere/land -- predict global atmospheric state (issued monthlyout to 7 months) -- NCEP global climate model (order 200 km resolution) 3 - Atmospheric medium-range forecast model (MRF): coupled atmosphere/land -- predict global atmospheric state (issued dailyout to 15 days) -- NCEP global medium-range model (order 75 km resolution) 4 - Atmospheric short-range forecast model (ETA): coupled atmosphere/land -- predict N. American atmospheric state (4 times daily out to 2.5 to 3.5 days) -- NCEP regional short-range model (order 22 km resolution) 5 - Atmospheric nested short-range forecast model (N-ETA): coupled atmos/land -- predict regional atmospheric state, (4 times daily out to 2 days) -- NCEP regional short-range forecast model (order 10 km resolution) 6 - Hurricane forecast model (GFDL) and RUC model (FSL).
Community Weather and Climate Models: NCEP partnerships 1 - Community global weather and climate model • Earth System Model framework • Atmosphere, Ocean, and Land modules • Partners: NCEP, NASA, NCAR, GFDL, DOE, MIT, others 2 - Community Weather Research and Forecast (WRF) regional model • Ultra-high 1-km spatial resolution for national/regional domains • Resolve individual thunderstorm cells • Partners: NCEP, NCAR, FSL, AFWA, others
Relocatable Eta “Nests” • High-resolution regional Eta forecasts "nested" inside of the parent Eta (22km/50 lev resolution) • Six nested domains are being run. • Hawaii and Puerto Rico twice per day • Alaska, East, West, Central U.S. once per day • Output available on NCEP ftp server
Homeland Defense Initiative NCEP Eta weather model is linked with NOAA/ARL radiological dispersion model known as HYSPLIT. This linked pair of models is executed at ultra-high spatial resolution of 4-km over any of the domains at right.
High Performance Computer • Ingests over 3.9 million observation reports daily • Produces 100 gigabytes of information daily • NCEP transmits 174,314 products each day • Second most powerful weather supercomputer in the world ! • ( 46X Faster than the Cray C90, 3.0 tflops peak performance ) • 584 nodes with four 375 MHz CPUs each (2336 processors) IBM SP at Bowie Computer Center in Bowie, MD NCEP Central Operations, Oct 2001
IBM SUPERCOMPUTER: Operational December 1999 Follow-on NCEP Modeling Advances 1 - Seasonal Forecast Model: Nov 01 -- transitioned to operations on IBM (from former demo platform) -- first formally operational seasonal forecast system in the world 2 - Global Medium-Range Model: Jan 00 -- resolution increase from 105-km/28-layers to 75-km/42-layers 3 - Eta Regional Short-Range Model: -- increase resolution from 33-km/45-layers to 22-km/50-layers: Sep 00 -- increase resolution from 22-km/50-layers to 12-km/60-layers: Nov 01 Also improvements in several NCEP models in cloud microphysics, precipitation assimilation, ingest of new radar and satellite observations, improved land surface physics, new tropical cyclone initialization. Next Slide: Example of impact of Eta Model resolution increase from 22-km to 12-km on a heavy convective precipitation event in Texas.
22 km Operational Meso Eta 10 km Experimental “Threats” Meso Eta Impact of Resolution on Model Precipitation Forecast 2.2” 4.3” Better location Better intensity Observed 7.0” 5.7”
Hydrological Applications Need Probabilistic Precipitation Forecasts Eta model-based 24-hour forecast valid 19 May 01; 24HR PQPF OF .25”
Ensemble Forecasting: Schematic example of ensemble predictions (used for derivation of probabilistic forecasts and measures of predictability).
Example of 8-day PQPF: Probabilistic Quantitative Precipitation Forecast (calibrated to remove bias)
NWS Office of Hydrologic Development (OHD): Ensemble Forecast Strategy for Water Management
Realistic soil moisture in coupled land-atmosphere climate models improves seasonal predictability of precipitation in the warm season
Improving Weather and Climate Prediction: Becoming a Complete Earth System Endeavor 1 - ATMOSPHERE: troposphere, stratosphere - initial conditions require atmosphere data assimilation 2 - OCEAN: deep ocean, seas, coastal ocean, sea ice - initial conditions require ocean data assimilation 3 - LAND: soil, snowpack, vegetation, runoff - initial conditions require land data assimilation
GAPP: GEWEX Americas Prediction Project (NOAA Office of Global Programs) Improving weather and climate prediction by bringing together meteorologists and hydrologists in: (A) coupled land-atmosphere modeling (B) land data assimilation (C) water resource applications of weather and climate forecasts
GENERAL CIRCULATION MODELS IMPROVED COUPLED CLIMATE MODELS MODEL DEVELOPMENT BASIN-SCALE HYDROLOGIC MODELS GCIP DATABASE MESOSCALE ATMOSPHERIC MODELS QUALITY ASSURANCE RETRIEVALS WATER AND ENERGY BUDGETS REGIONAL WATER ASSESSMENT REMOTE SENSING SATELLITE AND SURFACE IN SITU AND GIS FIELD AND ANALYTICAL STUDIES SITE SPECIFIC NONSITE SPECIFIC TRANSPORTABILITY DATA SOURCES The GAPP model development strategy
DATABASE DEVELOPMENT MODEL DEVELOPMENT ROUTINE ENHANCED Operational Path Research Path EOP RETROSPECTIVE OBSERVATIONS Intercompare Surface Hydro- logical Models Standard Resolution Meteorological Evaluate Current Models (GCM and Meso) Nonstandard Resolution Meteorological Scale Analysis Implement Upgraded Surface Hydrology Precipitation Radiation and Clouds Wind Water Vapor Improve Atmos- pheric Models Improve Cloud Parameterizations Hydrological Runoff Soil Moisture Evaporation Snow (water equivalent) Develop New Macroscale Hydrologic Models Algorithm Development Data Analysis Data Assimilation Geographical Evaluate and Improve Coupled Models Vegetation Field Campaign(s) GAPP-strategy for research infusion to operations
GAPP GCIP NCEP/EMC NWS/OHD NOAA/NESDIS Dan Tarpley John Schaake Ken Mitchell Bruce Ramsay Victor Koren Michael Ek* Dag Lohmann* Qingyun Duan AFWA NCAR George Gayno Brian Moore Fei Chen Jerry Wegiel Univ. Maryland NASA/GSFC Hugo Berbery Princeton Univ. Rachel Pinker Paul Houser Eric Wood Univ. Oklahoma NOAA/ARL Univ. Washington Ken Crawford Tilden Meyers Dennis Lettenmaier Atmospheric Research NCEP/CPC Univ. Arizona Alan Betts Wayne Higgins Soroosh Sorooshian James Shuttleworth Hoshin Gupta *UCAR/Visiting Scientist Program Collaborators
NCEP Eta model forecast during July 1998: Texas/Oklahoma drought, 24-hour forecast valid 00Z 27 July 1998 In late July 1998, after nearly two months of self-cycling the land states in the EDAS, the Eta model successfully captured the extremely dry soil moisture (upper left) and warm soil temps (upper right) over the Texas/Oklahoma region, yielding forecasts of high 2-m air temps (lower left) and deep, dry, hot boundary layers that verified well against raobs (e.g., at Norman, OK – lower right). soil moisture availability (1-m) soil temperature (5-cm) air temperature (2-meter) Norman, OK sonde (obs=solid, model=dashed)
Eta model Oct 2001 end-of-month soil moisture states and monthly observed total precipitation.
Monthly OBSERVEDPRECIPITATION accumulations Interannual variability of North American Monsoon - interior Southwest July 1999 July 2000 total precipitation (mm) dry moist departure from normal (mm) Monthly observed precipitation accumulation based on 0.25 deg lat/lon gridded analysis of daily total gage-only data (Higgins, R.W., W. Shi and E. Yarosh, 2000: Improved United States Precipitation Quality Control System and Analysis. NCEP/Climate Prediction Center ATLAS No. 7, 40 pp).
30 33 C 29 C 32 obs obs 23 24 Eta Eta 16 16 00 12 24 36 48 00 12 24 36 48 Eta forecast hour Eta forecast hour NORTH AMERICAN MONSOON Eta model captures interannual variability of daytime maximum temperature and model soil moisture July 1999 July 2000 Eta model end-of-month 2nd layer volumetric soil moisture relatively moist relatively dry Eta model monthly- mean 2-m (C) air temperature vs obs: interior Southwest interior Southwest
NOAH LAND-SURFACE MODEL UPGRADES cold season processes (Koren et al 1999) - patchy snowcover - frozen soil (new state variable) - snow density/snow depth (new state variable) bare soil evaporation refinements - parameterize upper sfc crust cap on evap soil heat flux - new soil thermal conductivity (Peters-Lidard et al 1998) - under snowpack (Lunardini, 1981) - vegetation reduction of thermal cond. (Peters-Lidard et al 1997) surface characterization- maximum snow albedo database (Robinson & Kukla 1985)- dynamic thermal roughness length refinements vegetation - deeper rooting depth in forests - canopy resistance refinements NOAH LSM tested in various land-model intercomparison projects, e.g. PILPS, GSWP, and (near-future) DMIP.
NOAH LSM soil thermodynamics tested successfully by OHD in Sacramento soil water accounting model (SAC-SWA). Example below: observed air temperature (top), and observed (white) and modelled (red) soil temperature at 20 cm, 40 cm, and 80 cm at Valdai, Russia (Oct 71-Sep 72).
NOAH LSM performs well in U. Arizona multi-criteria objective calibration system. NOAH LSM chosen as one of several land models to be used in their NSF Science and Tech Center.
Major Recent Multi-Institution Initiative LDAS: Land Data Assimilation System GOAL: provide soil moisture/temperature initial conditions Superior to present EDAS METHOD: drive stand-alone uncoupled land-surface models with observed gage/radar precipitation and satellite-derived surface solar insolation. - bypass atmospheric model precipitation and radiation biases ADDITIONS: assimilate satellite-derived soil moisture and skin temperature - test land-data assimilation tools (e.g. adjoint models, variational methods, Kalman filtering, surface emissivity models)
Real-time National LDAS Demonstration (Hosted by NCEP/EMC; Partners: NWS/OHD, NESDIS/ORA, NASA/GSFC, Princeton U., U. Washington, Rutgers U., U. Maryland, others) • U.S. domain at 1/8 deg. • executed from Apr 1999 to present (ongoing) - hosted on NCEP SGI-platform - website hosted at NASA/GSFC - retrospective runs back to Sep 1996 nearly complete (NASA-provided forcing) • hourly surface forcing - precipitation, incoming solar, downward longwave, air temperature, humidity, wind speed • 4 land-models executing in parallel - NOAH (NCEP), VIC (Princeton), MOSAIC (NASA), SAC-SWA(NWS-OHD) - 15 to 60 minute time steps • common outputs - soil moisture & temperature, snowpack, surface fluxes of water and energy, snowmelt, runoff • common streamflow connectivity and routing model - provided by Univ. Washington and Princeton
Soil Texture Classifications: 1 Sand 2 Loamy sand 3 Sandy loam 4 Silt loam 5 Silt 6 Loam 7 Sandy clay loam 8 Silty clay loam 9 Clay loam 10 Sandy clay 11 Silty clay 12 Clay 13 Organic materials 14 Water 15 Bedrock 16 Other NWS/OHD provided soil classes on LDAS domain Soils classification map as derived by NWS/OHD for the LDAS project for the 1/8-deg LDAS grid, using the 11-layer, 16-texture 1-km Penn State STATSGO data base (D. Miller, GAPP PI) and 5-minute ARS FAO data.
NOAH LSM 4-layer soil moisture from National-LDAS (valid 29 Feb 2000, 12Z)
USGS gage No. 01503000 USGS gage No. 01631000 The 188 basins chosen for LDAS-project streamflow validation using the respective USGS streamflow gaging stations. (Example time series for the two labeled basins are shown in next figure.)
NOAH LSM LDAS streamflow validation at two USGS gaging stations: Upper Susquehanna (station No. 01503000; 42.0353N - 75.8033W) and South Fork Shenandoah (station No. 01631000; 38.9139N - 78.2111W) for the period 21 June to 08 December 2000.
Future directions: • Propagate/unify NOAH LSM in all NCEP global and regional, weather and climate models • Extend national LDAS demonstration to global domain - in collaboration with NASA/GSFC (now underway) • Demonstrate impact of land-surface initial conditions and physics on seasonal climate predictability - especially warm season • Demonstrate impact of regional climate models on seasonal climate predictability
Issues for NOAA’s Science Advisory Board 1 - Expand research into methods to account for weather and climate model forecast precipitation biases in hydrological models and water resource applications. 2 - Increase emphasis on improving forecast model physical parameterizations of precipitation and water cycle processes: cloud microphysics, deep convection, cloud-radiation feedbacks, PBL fluxes and land-surface processes. 3 - “Stay the course” on developing community weather and climate models, and the linkages between weather and climate prediction. 4 - Sustain momentum towards aggressive expansion of supercomputer power and mass-storage systems.