Download
1 / 55
550 likes | 681 Vues
Session #7 – Organizing For Analytics Success. Hotel Wi-Fi HASummit14 PW: analytics. Current Session. App Questions? 3 app helpers Raise hand with mobile device Walk to back. 1. Thumbs Up. 2. Submit a Question. 3. Poll Question. 4.

E N D
Session #7 – Organizing For Analytics Success • Hotel Wi-Fi • HASummit14 • PW: analytics Current Session • App Questions? • 3 app helpers • Raise hand with mobile device • Walk to back 1 Thumbs Up 2 Submit a Question 3 Poll Question 4
Session #7 Organizing for Analytics Success Holly Rimmasch Chief Clinical Officer, Health Catalyst • Ms. Holly Rimmasch is Chief Clinical Officer at Health Catalyst. Prior to joining Health Catalyst, Ms. Rimmasch was an Assistant Vice President at Intermountain Healthcare and was integral in promoting integration of Clinical Operations across hospitals, ambulatory settings and managed care plans. Holly has spent the last 17 years dedicated to improving clinical care including implementation of operational best practices. Ms. Rimmasch holds a Master of Science in Adult Physiology from the University of Utah and a Bachelor of Science in Nursing from Brigham Young University. • Mr. Barlow is a co-founder of Health Catalyst. He oversees all technical client operations. Mr. Barlow is a founding member and former chair of the Healthcare Data Warehousing Association. He began his career in healthcare over 22 years ago at Intermountain Healthcare and acted as a member of the team that led Intermountain’s nationally recognized improvements in quality care and reductions in cost. Mr. Barlow holds a BS from the University of Utah in health education and promotion. • Steve Barlow Co-Founder and Senior Vice President of Client Operations, Health Catalyst
Where Do We Start? 80% Cumulative % 50% % of Total Resources Consumed for each clinical work process Number of Care Process Families (e.g., ischemic heart disease, pregnancy, bowel disorders, spine, heart failure) 7 CPFs 3 21 CPFs
Effective Approach to improvement: Focus on “Better Care” 1 box = 100 cases in a year Focus on Best Practice Care Process Model Mean # of Cases # of Cases Poor Outcomes Excellent Outcomes Poor Outcomes Excellent Outcomes • Option 2: Identify Best Practice • “Narrow the curve and shift it to the right”Strategy • Identify evidenced based “Shared Baseline” • Focus improvement effort on reducing variation by following the “Shared Baseline” • Often those performing the best make the greatest improvements • Current Condition • Significant Volume • Significant Variation
Internal Variation vs Resource Consumption 3 1 Y- Axis = Internal Variation in Resources Consumed 4 2 Bubble Size = Resources Consumed Bubble Color = Clinical Domain X Axis = Resources Consumed
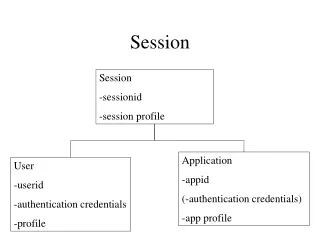
Three Systems of Care Delivery Overview Standard “Measurement” Work Datadriven prioritization Calculations Definitions EnterpriseDataWarehouse Datavisualization Standard “Organizational” Work Standard “Knowledge” Work Evidence gathering & evaluating Knowledge assets (e.g. Order Sets) Starter sets Value stream maps Patient safety protocols TeamStructures Roles Fingerprinting Implementation
Analytic System Core Activities • Unlocking Data to Drive Measurements • Automating the Broad Distribution of Information • Discovering Patterns in Data
Strong Analytic System Strong Analytic System The majority of time is spent analyzing and interpreting data Weak Analytic System Understanding the question Understanding the question Hunting for data Hunting for data Gather, compiling or running Interpreting data Gather, compiling or running Interpretingdata Data distribution Data distribution Non value-add Value-add
Enterprise Data Model (Technology Vendors) EDW FINANCIAL SOURCES DEPARTMENTAL SOURCES Patient Bad Debt Provider Provider Encounter Survey ADMINISTRATIVE SOURCES Cost Charge Census Facility House Keeping Diagnosis Procedure Pt. SATISFACTION SOURCES Employee EMR SOURCES Catha Lab Time Keeping Less Transformation More Transformation Enforced Referential Integrity
Independent Data Marts (Healthcare Point Solutions, EMRs) Redundant Data Extracts EDW FINANCIAL SOURCES DEPARTMENTAL SOURCES Regulatory Labor Productivity Revenue Cycle ADMINISTRATIVE SOURCES Pregnancy Oncology Asthma Heart Failure Diabetes Census EMR SOURCES Pt. SATISFACTION SOURCES Less Transformation More Transformation
Adaptive Data Model Metadata (EDW Atlas), Security and Auditing Common, linkable vocabulary FINANCIAL SOURCES DEPARTMENTAL SOURCES FinancialSource Marts DepartmentalSource Marts Readmissions AdministrativeSource Marts ADMINISTRATIVE SOURCES Diabetes Sepsis EMR Source Marts Patient Satisfaction Source Mart Pt. SATISFACTION SOURCES EMR SOURCEs Less Transformation More Transformation
The Enterprise Shopping Model E n t e r p r i s e S h o p p i n g M o d e l Produce Dairy __ Milk __ Eggs __ Cheese __ Cream __ 2% Milk __ Half & Half __ Yogurt __ Margarine __ Apples __ Pears __ Tomatoes __ Carrots __ Celery __ Banana __ Melon __ Grapes Meat Dry Goods __ Turkey __ Sausage __ Lamb __ Bacon __ Beef __ Ham __ Chicken __ Pork __ Baking soda __ Rice __ Beans __ B. Sugar __ Pasta __ Flour __ Sugar __ Soup
Your Shopping List Apples Tomato Soup Flour Milk Turkey Lettuce Sugar Beans Hot dogs Banana Noodles Yogurt
Additional Items • Get eggs • Buy flowers • Get tires rotated • Pick up dry cleaning
Enterprise Data Model (Technology Vendors) EDW FINANCIAL SOURCES DEPARTMENTAL SOURCES Patient Bad Debt Provider Provider Encounter Survey ADMINISTRATIVE SOURCES Cost Charge Census Facility House Keeping Diagnosis Procedure Pt. SATISFACTION SOURCES Employee EMR SOURCES CathLab Time Keeping Less Transformation More Transformation Enforced Referential Integrity
Using a Independent Mart Shopping Model https://dl.dropboxusercontent.com/u/355034/CATALYST%2090%20Second.mp4.zip
The Independent Mart Shopping Model Dry Goods Dairy Dairy Dry Goods __ 1 c sugar __ 2 c brown sugar __ 2 t baking soda __ 2 t vanilla __ 1 t salt __ 4-5 c all-purpose flour __ 4 cups chocolate chips __ 4 eggs __ 2 c shortening __ ½ cup of butter __ ½ cup milk __ 2 eggs __ 1 cup white sugar __ 1 ½ cups all-purpose flour __ 2 teaspoons vanilla extract __ 1 ¾ teaspoon baking powder Trip #1 to the Store Trip #2 to the Store Independent Mart Shopping Model Chocolate Chip Cookies Independent Mart Shopping Model Cake How many recipes do you need to make?
Independent Data Marts (Healthcare Point Solutions, EMRs) Redundant Data Extracts EDW FINANCIAL SOURCES DEPARTMENTAL SOURCES Regulatory Labor Productivity Revenue Cycle ADMINISTRATIVE SOURCES Pregnancy Oncology Asthma Heart Failure Diabetes Census EMR SOURCES Pt. SATISFACTION SOURCES Less Transformation More Transformation
The Adaptive Shopping Model A d a p t i v e S h o p p i n g M o d e l Store: __________________________________________________ __ ______________________ __ ______________________ __ ______________________ __ ______________________ __ ______________________ __ ______________________ __ ______________________ __ ______________________ __ ______________________ __ ______________________ __ ______________________ __ ______________________ __ ______________________ __ ______________________ __ ______________________ __ ______________________ __ ______________________ __ ______________________ __ ______________________ __ ______________________ __ ______________________ __ ______________________
Shopping List Revisited Additional Items Once you are home, can you make these recipes? Initial List Get eggs Buy flowers Get tires rotated Pick up dry cleaning Cookies: 2cups shortening 4 large eggs 1 cup sugar 2 cups brown sugar 2 t vanilla 1 t salt 2 t baking soda 4 cups all-purpose flour 4-5 cups chocolate chips Sugar Beans Hot dogs Banana Noodles Yogurt Cake: 1 cup white sugar 1 ½ cups all-purpose flour 2 teaspoons vanilla extract 1 ¾ teaspoon baking powder ½ cup of butter ½ cup milk 2 eggs • Apples • Tomato Soup • Flour • Milk • Turkey • Lettuce And Even More Baking Powder • Baking Soda • Buy a new couch • Get oil change • Chocolate Chips • Buy yarn and knitting supplies • Vanilla extract
Adaptive Data Model Metadata (EDW Atlas), Security and Auditing Common, linkable vocabulary FINANCIAL SOURCES DEPARTMENTAL SOURCES FinancialSource Marts DepartmentalSource Marts Readmissions AdministrativeSource Marts ADMINISTRATIVE SOURCES Diabetes Sepsis EMR Source Marts Patient Satisfaction Source Mart Pt. SATISFACTION SOURCES EMR SOURCEs Less Transformation More Transformation
Poll Question #1 - Analytic • How would you describe your analytics and enterprise data warehousing approach? (choose the best answer that applies) • We do not currently have a centralized analytics data repository (e.g., enterprise data warehouse-EDW) • We have an EDW based on the enterprise data model approach • We have an EDW based on the independent data mart approach • We have an EDW based on the adaptive or late-binding architecture approach • Unsure or not applicable
Content System Core Activities • Defining a Clinically Driven Patient Cohort • Using Evidence to Identify Three Types of Waste • Standardizing Care Delivery through Shared Baselines.
Strong Content System Habit of all Front-line Clinicians at Every Facility New Clinical or Operational Best Practice Knowledge Discovered Time Strong Content System Measured in Weeks Weak Content System Measured in Years
Clinical Content System Components • What Types of Waste are created without standard work? • Ordering Waste: Populations (Heart Failure, Diabetes, etc.) • Workflow Waste: Departmental • Patient Injury Waste: Patient Safety • How do we accelerate Evidence Integration into Care Delivery? • Evidence Based Population Management Content: Outcome, process and balanced metrics related to improvement AIM statements, intervention indications, triage criteria, order sets, indications for referral, patient and provider education materials, predictive algorithms, care guidelines and protocols • Evidence Based Patient Safety Content: Outcome, process and balanced metrics related to improvement AIM statements, At risk screening criteria, safety protocols, near miss and incident tracking • How can data accelerate Waste Elimination? • Value Stream Maps, A3s, Standard Work starter sets, Outcome, process and balanced metrics related to improvement AIM statements
Find as many numbers sequentially from 1 to 50 in 20 seconds. On your mark… Get set… GO!
9 31 15 21 10 8 41 3 8 28 26 5 46 2 6 34 16 40 22 44 50 36 19 48 32 45 23 43 47 1 13 39 3 27 42 30 49 12 11 35 7 18 25 24 4 17 20 37 29 33 ROUND #1 14
Find as many numbers sequentially from 1 to 50 in 20 seconds. On your mark… Get set… GO!
25 1 17 29 5 21 41 35 7 45 53 33 37 15 49 43 9 23 31 13 3 19 27 39 47 14 50 22 4 36 32 8 28 12 24 42 18 30 2 26 40 38 16 46 20 6 34 48 10 44 ROUND #2 31
Find as many numbers sequentially from 1 to 50 in 20 seconds. On your mark… Get set… GO!
ROUND #3 33
Poll Question #2 - Content • Rate the level of content standardization (choose the answer that best applies) • No standardization. Our clinicians use their best judgment based on their individual training • We have begun to standardize some content (e.g. CPOE to implement standardized order sets – provided by our EMR vendor) We have not yet created standard content for both workflow and clinical domains across the continuum of care • High degree of standardization, including standardized content for ambulatory and inpatient care management and utilization criteria. The same workflow and care delivery content is followed and measured regardless of what unit or facility a patient enters • Unsure or not applicable
Deployment System Core Activities • Organizing for Scalable Improvement • Applying Agile Principles to Care Improvement • Accelerate Root Cause Analysis by Combining Analytics and Lean Principles
Strong Deployment System Weak Deployment System Strong Deployment System Improvement with permanentintegratedteams Baseline Performance Improvement with focused project team Inability to sustain gains over time Baseline Performance Gains sustained over time
Population Health Hierarchy “Ordering of Care” CV W&C GI Neuro Sciences Musculo-skeletal General Med Resp-iratory Primary Care Surgery Oncology Peds Spec Mental Health Care Process Families e.g., Diabetes Care Process Families e.g., Depression Care Process Families e.g., Pregnancy Care Process Families e.g., Obstructive Lung Disorders Care Process Families e.g., Urologic Disorders Care Process Families e.g., Breast Cancer Care Process Families e.g., Peds CV Surg Care Process Families e.g., Heart Failure Care Process Families e.g., Lower GI Disorders Care Process Families e.g., Spine Disorders Care Process Families e.g., Joint Replace-ment Care Process Families e.g., Infectious Disease
Organization of teamsClinical and technical SENIOR EXECUTIVELEADERSHIP TEAM GUIDANCE TEAM Provides overall governance and prioritization of initiatives CONTENT ANDANALYTICSTEAM CLINICALIMPLEMENTATIONTEAM Provides steady state domain governance and oversight Oversees data governance Supports developmentof clinical content and analytics feedback Refines Work Group output and leads implementation WORKGROUP Provides a forum to develop and/or refine clinical content and analytics feedback
OrganizationalTeams = Subject Matter Expert = Data Capture = Data Provisioning & Visualization Women & Children’s Clinical Program Guidance Team = Data Analysis Pregnancy MD Lead RN SME Gynecology MD Lead RN SME Normal Newborn MD Lead RN SME Guidance Team Leads MD Lead Pregnancy SAM Normal Newborn SAM Gynecology SAM Nurse Lead DataArchitect Application Administrator Knowledge Manager • Permanent Teams • Integrated Clinical and Technical members • Supports Multiple Care Process Families
= Subject Matter Expert Information Management = Data Capture = Data Provisioning = Data Analysis DATA CAPTURE • Acquire key data elements • Assure data quality • Integrate data capture into operational workflow Knowledge Managers (Data quality, data stewardship and data interpretation) Application Administrators (optimization of source systems) DATA ANALYSIS DATA PROVISIONING • Interpret data • Discover new information in the data (data mining) • Evaluate data quality • Move data from transactional systems into the Data Warehouse • Build visualizations for use by clinicians • Generate external reports (e.g., CMS) Data Architects(Infrastructure, visualization, analysis, reporting)
Standard “Organizational” Work Overview Implementation Design AIM Statement Launch Approval Results Review Kickoff • Mission • Cohort Discover • Data Analysis and Review • Best Practices • Building Multiple Potential AIM statements • Supplement content • Refine Cohort • Refine Metrics • Develop Draft Visualizations • Develop Recommended AIM statement #1 • Cluster Reps Obtain Front Line Input • Finalize Cohort • Develop Additional metrics based on feedback • Develop Additional Visualizations to support • PDSA cycle • Cluster Reps Obtain Front Line Input • Improvement Plan • Implementation Plan • Develop cluster rep assignments, and deliverables • Collect cluster rep feedback • Prepare Initial Results from AIM statement #1 • Summarized report for historical review • Refine, recommend AIM statement #2 Monthly Tasks and Checkpoints 7 Steps (Work Streams) 1.Gather Knowledge Assets 2.Define Cohort 3.Select AIM Statement Select Initial Metric Build and Refine Build and Refine Build and Refine 4.Select, Build, Refine Metrics 5.Develop Implementation Planfor Process Improvement 6. Implementation 7. Measure Progress
1 minute to describe 1 minute to draw Round 1 50 51 52 54 55 56 57 58 59 1M 32 33 49 48 53 46 47 35 36 37 39 40 38 34 42 43 44 45 2 31 41 0 15 18 19 20 21 22 23 24 26 27 28 29 17 16 25 30 14 3 4 5 7 8 6 1 10 11 12 13 9 53 50 51 52 54 1M 56 57 58 59 32 55 49 0 34 35 36 37 48 39 38 41 42 43 44 45 40 1 47 33 13 31 22 19 20 21 23 29 25 26 27 28 18 24 17 46 3 14 12 11 10 9 8 7 6 5 4 30 2 16 15 • Only the Clinician can talk • The Architect cannot look at the drawing (no mind reading) • The Architect can’t start drawing • Only the Architect can draw • The Clinician can only watch – no talking
2 minutes to describe and draw interactively Round 2 3 4 5 6 7 8 9 10 11 12 13 14 31 15 17 18 19 20 21 22 23 24 25 26 27 28 29 16 2 30 1 0 34 35 36 37 38 39 40 32 42 43 44 45 46 47 41 49 48 33 1M 59 57 56 58 54 53 52 51 50 55 9 12 11 10 8 29 6 5 4 3 2 7 13 28 15 16 17 18 19 20 21 22 23 24 25 26 27 31 14 0 46 59 30 1M 1 33 34 35 36 37 38 39 40 41 42 32 43 45 47 48 49 50 51 52 53 54 55 56 57 58 44 • The Architect still cannot look at the drawing (still no mind reading capabilities ) • You can interact as much as you want • You can erase and redraw
Poll Question #3 - Deployment • How are teams organized to improve the quality of care and sustain improvements? (choose the answer that best applies) • We have ad hoc, reactive improvement teams organized on a project basis • Our quality department supports service lines and departments for quality and workflow improvement initiatives • We have organized, permanent, interdisciplinary, process improvement teams. These teams permanently own the quality, cost, safety and satisfaction of their care delivery domain • Unsure or not applicable
Poll Question #4 - Deployment • How do you align and prioritize improvement priorities across your organization? (choose the answer that best applies) • We don’t have alignment of our improvement priorities. We have free form improvement that is prioritized in silos across the organization • We have alignment of our improvement priorities within our hospital, but not across our entire enterprise • We have a very clear prioritization and governance process for our improvement priorities, tied to our strategic plan • Unsure or not applicable
Problems with Missing Systems Information System Centric If we build it they will come. Focus on reducing information request queue. Automation Centric Paved Cow Paths (Process is automated but not improved – many EMR deployments.) • Analytic System Science Project Centric Pockets of excellence, Limited roll-out of improvements. Organization Centric NULL SET (Clinicians stop coming to meetings if evidence and measurement are both missing.) • Deployment System • Content System Research Centric Academic ideas with no practical application. Lots of published papers. LEAN Centric Un-sustainable Improvements. Can’t manually measure after 2 or 3 projects.