Download
1 / 44
520 likes | 1.06k Vues
Trends in the Periodic Table. Development of the Periodic Table The periodic table was invented by Dimitri Mendeleev (1869).

E N D
Development of the Periodic Table • The periodictable was invented by Dimitri Mendeleev (1869). • He arranged elements in order of increasing atomic mass, and noted that their properties e.g. Melting point, boiling point and density were periodic in nature (repeating patterns existed). . • Those elements with similar properties were placed below one another in groups and gaps were left for unknown elements.
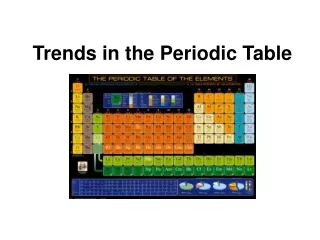
The Modern Periodic Table • The modern periodic table is based on an elements atomic number, and this removed a number of the anomalies in the original version.
Trends in Physical Properties of the Elements Melting points and boiling points • Melting points and boiling points show periodic properties. This means that they vary in a regular way or pattern depending on their position in the Periodic Table. • Melting points and boiling points depend on the strength of forces which exist between the particles which make up a substance. • The M.pt. & B.pt. values peak at Carbon in period 2 and at silicon in period 3.
Trends in Physical Properties of the Elements Melting points and boiling points • In general the forces of attraction (intermolecular bonding) for elements on the left of the table must be stronger, or more extensive than between the particles on the right. • Going down group 1 the alkali metals M.pt. & B.pt. decrease so there must be a decrease in the force of attraction between the particles. • Going down group 7 the halogens m.pt. increases so there must be a increase in the force of attraction between the particles
Variation of melting point with atomic number Adapted from New Higher Chemistry E Allan J Harris
Variation of boiling point with atomic number Adapted from New Higher Chemistry E Allan J Harris
Variation of melting point with atomic number Adapted from New Higher Chemistry E Allan J Harris Determined by the strength of intermolecular bonding, between particles period 2,peak at carbon period 3,peak at silicon In general the forces of attraction (intermolecular bonding) for elements on the left of the table must be stronger, or more extensive than between the particles on the right. Li Na Ar Ne
Variation of melting point with atomic number Adapted from New Higher Chemistry E Allan J Harris Down group 1 the alkali metals m.pt. decrease there must be a decrease in the force of attraction between the particles Li Na K Rb Cs
Variation of melting point with atomic number Adapted from New Higher Chemistry E Allan J Harris Down group 7 the halogens m.pt. increases there must be a increase in the force of attraction between the particles I Br Cl F
Variation of boiling point with atomic number Adapted from New Higher Chemistry E Allan J Harris period 2,peak at carbon period 3,peak at silicon In general we see the same trend in boiling point across the period Li Na Ne Ar
Variation of boiling point with atomic number Adapted from New Higher Chemistry E Allan J Harris Down group 1 the alkali metals b.p. decrease once again there must be a decrease in the force of attraction between the particles Li Na K Rb Cs
Variation of boiling point with atomic number Adapted from New Higher Chemistry E Allan J Harris Down group 7 the halogens b.p. increases once again there must be a increase in the force of attraction between the particles Br I Cl F
Density • The density of a substance is its mass per unit volume, usually in g/cm3.
Trends in Physical Properties of the Elements Density • The density values peak at Boron (a group 3 element) in period 2 and at Aluminium (another group 3 element) in period 3. • In general in any period of the table, density first increases from group 1 to a maximum in the centre of the period, and then decreases again towards group 0. • Going down a group gives an overall increase in density.
Variation of density (g cm-3) with atomic number Adapted from New Higher Chemistry E Allan J Harris
Variation of density (g cm-3) with atomic number Adapted from New Higher Chemistry E Allan J Harris period 2 (Li - Ne) maximum at boron (B) - group3 period 3 (Na - Ar) maximum at Aluminium (Al)- group 3 Al B Na Li Ne Ar
Variation of density (g cm-3) with atomic number Adapted from New Higher Chemistry E Allan J Harris In general in any period of the table, density first increases from group 1 to a maximum in the centre of the period, and then decreases again towards group 0 5th 4th 3rd 2nd
Variation of density (g cm-3) with atomic number Adapted from New Higher Chemistry E Allan J Harris down a group gives an overall increase in density In Ga Al B Cs Rb Na K Li
Trends in Physical Properties of the Elements Atomic Size There is no definite edge to an atom. However, bond lengths can be worked out. Covalent radius gives us a measure of atomic size. It is defined as half the distance between the centres (nuclei) of 2 bonded atoms. The covalent radius is measured in picometres. pm = picometre X 10 – 12 m N.B. To find the bond length, add 2 covalent radii together.
Atomic Size & Covalent Radius • As we go across a period, the nuclear charge and the number of outer electrons increase. • As we go down a group, the number of electron shells or energy levels increases but the number of outer electrons stays the same. • The trends in atomic size (as measured by covalent radius) in the periodic table are: • Across a period the atomic size (covalent radius) decreases as the nuclear charge increases and attracts the outer electrons closer to the nucleus. • Down a group the atomic size (covalent radius) increases as an extra electron shell is added.
Variation of covalent radius with atomic number Adapted from New Higher Chemistry E Allan J Harris Rb K Na Li I Br Cl The covalent radii of the elements in any period decrease with increasing atomic number. F
Variation of covalent radius with atomic number Adapted from New Higher Chemistry E Allan J Harris Cs Rb K Na Li I Br Cl The covalent radii of the elements in any groupincrease with increasing atomic number. F
Variation of covalent radius with atomic number Adapted from New Higher Chemistry E Allan J Harris No values are given for the Noble gases Why? Unreactive so do not form bonds
Covalent radius Trends in Physical Properties of the Elements
First Ionisation Energy Trends in Physical Properties of the Elements This is defined as "the amount of energy required to remove one mole of electrons from one mole of atoms in the gaseous state” Energy M (g) M+(g)+ e 1st ionisation e e + The outermost electron will be the most weakly held and is removed first + M (g) The ionisation energy is an enthalpy change and therefore is measured per mole. Its units are kJmol-1 (kilojoules per mole).
Second Ionisation Energy This is defined as "the amount of energy required to remove one mole of electrons from one mole of gaseous 1+ ions” Energy e M (g) M+(g)+ e 1st ionisation e + M +(g) 2 M(g)+ M(g)2++ e 2nd ionisation
First and Second ionisation energies of the first 20 elements Adapted from New Higher Chemistry E Allan J Harris In each period there is an overall increase peaking at the noble gas He Ne Ar H Li Na
First and Second ionisation energies of the first 20 elements Adapted from New Higher Chemistry E Allan J Harris Down a group first ionisation energy decreases He Ne Ar Li Na K
First and Second ionisation energies of the first 20 elements Adapted from New Higher Chemistry E Allan J Harris For each element the second ionisation energy is higher than the first ionisation energy.
First and Second ionisation energies of the first 20 elements Adapted from New Higher Chemistry E Allan J Harris It is worth noting the Noble gases have the highest value for each period. This goes some way to explaining the great stability of filled orbital's and the resistance of the Noble gases to form compounds. He Ne Ar
First Ionisation Energies (kJ mol-1) Overall increase along period Decrease down group
Trends in Ionisation energy • Across a period ionisation energies increase. • This is because the nuclear charge increases (greater positive charge on the nucleus)and holds the outer electrons more strongly.More energy needs to be supplied to remove the electron. • Within each period the noble gas has the highest value for the 1st ionisation energy explaining the stability of full electron shells. • Down a group ionisation energies decrease. • This is because the outer electrons are further awayfrom the nucleus. The screening effect of the inner electron shells reduces the nuclear attraction for the outer electrons, despite the increased (positive) nuclear charge.
Why is the second ionisation energy of an element always greater than the first ionisation energy? First ionisation energy – first mole of electrons removed M(g) M+(g) + e Second ionisation energy – second mole of electrons removed M+(g) M2+(g) + e In the second ionisation energy negative electrons are being removed from positive ions rather than neutral atoms. In the positive ion there is a greater attraction for the electrons so more energy is needed to remove the second mole of electrons.
Why is the second ionisation energy of K much greater than the second ionisation energy of Mg? K (g) K+ (g) + e Mg (g) Mg+ (g) + e 2,8,1 2,8,8,1 2,8,8 2,8,2 K+(g) K2+ (g) + e Mg+ (g) Mg2+ (g) + e 2,8,8 2,8,7 2,8,1 2,8 The second ionisation of K involves removing an electron from a stable electron arrangement. This requires a lot of energy The second ionisation of Mg involves removing an electron to form a stable electron arrangement. This requires less energy
Trends in Ionisation energy • Successive ionisation energies increase as the atom becomes more positive. • There is a large jump in ionisation energy when the electron to be removed comes from a new shell, closer to the nucleus. e.g. between the 2nd and 3rd ionisation energy for magnesium. • The total energy to remove more than 1 mole of electrons is equal to the sum of each mole added together (as above).
Electronegativity Electronegativity is a measure of an atom’s attraction for the shared pair of electrons in a bond e e C H Trends in Physical Properties of the Elements Which atom would have a greater attraction for the electrons in this bond and why?
Linus Pauling Linus Pauling, an American chemist (and winner of two Nobel prizes!) came up with the concept of electronegativity in 1932 to help explain the nature of chemical bonds. Today we still measure electronegativities of elements using the Pauling scale. Since fluorine is the most electronegative element (has the greatest attraction for the bonding electrons) he assigned it a value and compared all other elements to fluorine. Values for electronegativity can be found on page 10 of the data book
Electronegativities In the element chlorine both atoms have the same electronegativity so the electrons are shared equally. In the compound hydrogen iodide the bonded atoms have different electronegativities. The iodine atom has a bigger attraction for the shared electrons than the hydrogen atom. As the electrons are attracted closer to the iodine it becomes slightly negative (δ-) and the hydrogen atom becomes slightly positive (δ+). δ+ δ- H I
Looking across a period IncreasingElectronegativity F C B Li Be N O 2.0 2.5 3.0 3.5 4.0 1.0 1.5 What are the electronegativities of these elements? Across a period electronegativity increases The charge in the nucleus increases across a period. Greater number of protons = Greater attraction for bonding electrons
Looking down a group F Cl DecreasingElectronegativity Br I 4.0 3.0 What are the electronegativities of these halogens? 2.8 2.6 Down a group electronegativity decreases Atoms have a bigger radius (more electron shells) The positive charge of the nucleus is further away from the bonding electrons and is shielded by the extra electron shells.
The trend in electronegativity is: • Across a period, electronegativity increases. • This is because the nuclear charge increases, attracting the electrons more strongly to the nucleus. As a result, the electronegativity increases. • Down a group, electronegativity decreases. • Going down the group, the nuclear charge increases but the number of electron shells also increases. As a result of ‘shielding’ and the increased distance the outer shell is from the nucleus, electronegativity decreases.
Internet Links – Trends in the Periodic Table Chemical bonds: types of bonds Explores how different types of bonds are formed due to variations in the electronegativity of the bonded atoms. The distortion of the orbitals and the polarity of the bond is also displayed. Linus Pauling (1901-1994) An account of the life and work of the Nobel Prize-winning chemist, Linus Pauling. Periodic Table of Data Visual database of the physical and thermochemical properties of the chemical elements which allows the user to plot graphs and tables, play games and view diagrams.