Download
1 / 30
300 likes | 417 Vues
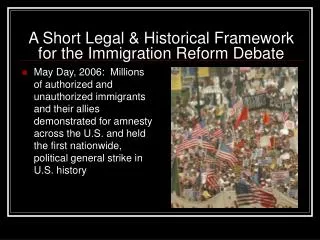
May Day, 2006: Millions of authorized and unauthorized immigrants and their allies demonstrated for amnesty across the U.S. and held the first nationwide, political general strike in U.S. history . A Short Legal & Historical Framework for the Immigration Reform Debate.

E N D
May Day, 2006: Millions of authorized and unauthorized immigrants and their allies demonstrated for amnesty across the U.S. and held the first nationwide, political general strike in U.S. history A Short Legal & Historical Framework for the Immigration Reform Debate
Securing the Homeland: The War Abroad & At Home • Within 10 years, the Detention and Removal Program will ensure the departure of “all removable aliens through the fair and effective enforcement of our nation’s immigration laws.”
U.S. Immigration: the First Two Hundred Years • First One Hundred: unrestricted immigration • 1790-1820: 250,000 immigrants arrived • 1820-1880: 10 million immigrants arrived • But the beginning of racist exclusions • Chinese Exclusion Act - 1882 • Suspended all Chinese immigration - was not repealed until 1943, finally allowing Chinese immigrants to become citizens
Second Hundred Years: Xenophobia, Racism & Working Class Militancy Shape Early 20th Century Immigration Law • 1880s - 72% of immigrants were of northern & western European descent • 1990-1910 - 71% of immigrants were southern or eastern European (Italians, Slavs & Jews) • 1917 Immigration Act - • barred those unable to read & imposed an $8 head tax • Created the ‘Asiatic Barred Zone’ barring Asians • Anarchist Act of 1918 - • Political exclusion and expulsion of radical-minded European workers
Post-World Wars: Quotas and Restrictions • 1920’s: Series of immigration acts limit immigration to small percentages of persons from European nationalities residing in US based on census data • Intended Effect - limit immigration from disfavored southern and eastern regions • Mexican/American border patrol begins • 1930’s - Depression led to deportations of 1/2 million • Post WW II - • Short period of liberalization allowing WW II refugees from Germany, Austria & Italy and later refugees fleeing Soviet takeover of E. Europe (all total, about 1/2 million) • Internal Security Act (1950) - barring anyone likely to engage in ‘subversive activity’
Immigration & Nationality Act of 1952 • INA retained discriminatory national origin quotas & 150,000/year limit on immigrants from Eastern Hemisphere • Hierarchy within the quota system • First, entrants with skills needed for economy • Then persons with close family relations to citizens or permanent residents (immediate relatives - spouse/children outside quota system)
Bracero Program- 1942-1964The largest U.S. labor contract program in the 20th Century • 4.5 million Mexicans legally contracted for seasonal agricultural work in the U.S. • 1 out of 2 seasonal migratory labor jobs was held by Mexicans • 1952 - The Bracero Program did not stop deportations. INS begins ‘Operation Wetback’; deporting more than 720,000 Mexicans (90% of those deported that year) • 1954 - INS deports 1 million workers • Deportations included U.S. citizens of Mexican descent denied due process and right to prove their claim of US citizenship • 1964/1965 - Caesar Chavez begins UFW grape boycott
Prelude to “Reform” • 1980 - • almost 6 million unauthorized persons in the U.S. • Immigration & Naturalization Service (INS) • Employed 11,000 • Annual Budget $300 million • Annual deportations of unauthorized individuals routinely exceeds 1 million
More $$ for immigration enforcement Prohibited discrimination based on national origin or citizenship status Reestablished a guest worker program Established an employment verification (I-9) system Criminal sanctions and civil fines if employer knowingly hires unauthorized workers Amnesty - one time, must show entered before 1/1/82 and had resided illegally and continuously in the US and meet requirements of immigrant admissibility or U.S. government aware of valid, but expired non-immigrant status. Disqualified newly legalized non-citizens from receiving public welfare assistance for 5 yrs (except Cuban/Haitian entrants) Immigration Reform & Control Act - 1986 (IRCA)
9-11 and Immigration Law: Patriot Act & Homeland Security Act • Established Dept. of Homeland Security • Immigration & Customs Enforcement (ICE) • Customs and Border Patrol (CBP) • Citizenship & Immigration Services (CIS) • Broadened definition of terrorist • Monitoring of Non-Citizens • Resulting in Profiling and Widespread Rights Violations of Muslims and Arabs
Legal Status of Immigrants • 35.7 million foreign born • 11.3 million naturalized citizens • 10.4 million Legal Permanent Residents (LPR) 2.5 million Refugees (post 1980) • 1.2 million temporary legal residents • 10.3 million Unauthorized (Undocumented)
How IRCA Classifies Immigrants • Lawful Permanent Residents (LPRs) • Naturalized (former LPR) • Refugee Arrivals • Temporary Legal Residents - 1.2 million • H1-B - highly skilled workers • H2-A - agricultural workers • H2-B - non-agricultural industries, e.g. forestry, landscaping, tourism, seafood processing • Non-immigrants (undocumented/unauthorized)
Immigrants are essential to the U.S. Economy • 15% of civilian workforce • Majority non-citizens 12.7 million (63%) • Minority naturalized citizens 7.6 million (37%) • Immigrant are critical to future growth • New immigrants contributed at least 60% of growth in civilian labor force over past 5 years • Immigrants will account for • 1/2 working age population between 2006 & 2015 • All growth between 2016 and 2035
Immigrants Face Inequality Working in the U.S. Labor Market • Over-represented in highest risk, lowest paid jobs • Lack access to basic social services • Deprived of workplace rights • Most denied lawful residence and path to citizenship
Over-represented in highest risk, lowest paid jobs • Of 43.1 million low-wage workers, 8.6 million foreign born • 2 million immigrant workers earn less than minimum wage; 1 in 4 low wage workers is an immigrant • Average low-wage immigrant worker earns $14,400/yr • 1/2 of all immigrant workers earn less than 200% of minimum wage (compared to 32% of native born workers) • * Low wage is 200% minimum wage in the state of residence
Lack of Access to Education & health care • Only 26% of immigrants have job-based health insurance • 28% of low wage immigrant workers have not completed 9th grade (2% for native born); almost 1/2 have not completed high school • 28% of immigrant labor force with less than a high school education has limited English language proficiency (LEP) • 62% of low wage immigrant workers are LEP
Guest Workers and Undocumented • Failure of laws designed to protect workplace rights • Deprived of lawful residence and path to citizenship
12 Million - 30% of foreign-born - are unauthorized immigrants • 66% in the U.S. for less than 10 years • 40% less than 5 years • Men 49%, Women 35%, 16% Children * • 56% of undocumented workers are Mexican • 22% from the rest of Latin America, mostly C.A. • 850,000 undocumented workers enter yearly • 25-40% of undocumented workers enter the country legally and overstay their visas * 3.1 Million children are U.S. citizens who live in families where one parent or head of household is unauthorized (2/3 of children living in unauthorized families are children)
The Futile Work of the U.S. Border Patrol: Arrest & Removal of Jobseekers Minuteman Border Proposal
Undocumented Labor Force - By Industry - 2005 • 33% in service jobs (16% native workers) • 17% in ‘leisure & hospitality • 20% in construction • 15% in manufacturing/repair • 4% in farming • More men the women in workforce • Men - higher then native born (94% v. 83%) • Women - lower then native born (54% v. 72%)
Denied Rights at Work • I-9 Requirements & SS no-match letters create vulnerability, discrimination & exploitation • Workplace raids by ICE - Danbury & New Bedford • Employer threats - veiled & overt • IRCA trumps federal workplace protections • Labor rights & anti-discrimination law - formal protection but • No remedies, weak remedies or difficulty of enforcement • Patchwork of state by state protections
Guest Worker Programs “Indentured Servitude” • H-2 Program - Employer must obtain certification from DOL that: • Lack of sufficient U.S. workers able, willing & qualified at time and place needed • Wages/working conditions of U.S. workers will not be “adversely affected” • H-2 visas are only for individuals - family members not permitted • 121,000 H-2 workers in 2005
H-2A entitlements 3/4 guarantee Free housing Workers’ Compensation Travel reimbursement after 50% of contract complete Health & Safety protection Eligible for federally funded legal services for work-related issues H-2A: agriculture H-2B entitlements No housing No 3/4 guarantee No DOL enforcement of prevailing wage No access to legal services No travel reimbursement No social security exemption H-2B: tourist, forestry, seafood industry, landscaping H-2 Program Standards
H-2 - “… the closest thing I’ve seen to slavery” Charles Rangel, House Ways and Means Chair • Routine wage & hour violations • Misclassification to lower wages • Huge Fees Paid for Access to Jobs • Documents seizure by employers • Substandard Housing • Denied Medical Benefits
Labor Brokers: Exploitation Begins at Home • Example: Hurricane Katrina & the Decatur Hotels in New Orleans • Each worker paid $3500 to $5000 for 9 month contract • Labor contractor earned $1200 for each of 290 workers brought from Peru, Bolivia & Dominican Republic • Promised 40/wk - worked less than 25 hrs • Prohibited from working other jobs • Forced to leave property or other collateral in exchange for contract to work in U.S.
Wage & Hour Violations: A Race to the bottom • Forestry • Obligation to pay prevailing wage, but • Often paid by by # of seedlings planted • Employer obligated to pay difference • Employer fails to make up difference • Seafood Processing - Va. & N. Car. - 10 lawsuits since 1998 • Piece-rate that failed to reach minimum wage • Deductions for tools, travel and uninhabitable housing • Failure to pay time and one-half for over 40 hours • All lawsuits settled • Absence of free labor market and scant resources for enforcement of basic wage and hour laws guarantee exploitation of vulnerable guestworkers
Injured, Blacklisted & No Government Enforcement • Workers’ Compensation - No clear rules • Cut-off when workers leave the country • Discouraged and pressured not to report • Threat of blacklisting • Systemic Discrimination • Women placed in less lucrative H-2B jobs • Differential wage rates based on nationality • Vulnerable to sexual harassment and abuse
Amnesty - Path for Lawful Permanent Residence & Citizenship or Guest Workers? • For more information: • Mass. Immigrant & Refugee Advocacy Coalition: www.miracoalition.org • National Immigration Law Center www.nilc.org • AFL-CIO - www.aflcio.org • ACLU - www.aclu.org • National Employment Law Project www.nelp.org • Southern Poverty Law Center www.splcenter.org • Assoc. of Immigration Lawyers Assoc. www.aila.org • Pew Hispanic Center www.pewhispanic.org