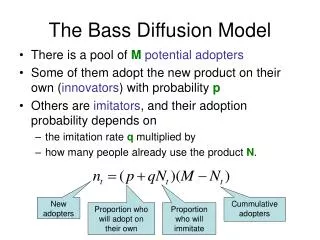
Applying the Wiener diffusion process as a psychometric measurement model
340 likes | 577 Vues
Applying the Wiener diffusion process as a psychometric measurement model. Joachim Vandekerckhove and Francis Tuerlinckx Research Group Quantitative Psychology, K.U.Leuven. Overview. An example problem The diffusion model Cognitive psychometrics Random effects diffusion models

Applying the Wiener diffusion process as a psychometric measurement model
E N D
Presentation Transcript
Applying the Wiener diffusion process as a psychometric measurement model Joachim Vandekerckhove and Francis Tuerlinckx Research Group Quantitative Psychology, K.U.Leuven
Overview • An example problem • The diffusion model • Cognitive psychometrics • Random effects diffusion models • Explanatory diffusion models • Conclusions
An example problem • Speeded category verification task • Participants evaluate item category memberships
An example problem • Speeded category verification task • Participants evaluate item category memberships
An example problem • Speeded category verification task • Participants evaluate item category memberships
An example problem • Speeded category verification task • Participants evaluate item category memberships
An example problem • Speeded category verification task • Participants evaluate item category memberships
An example problem • Speeded category verification task • Participants evaluate item category memberships • Measure both RT and response
An example problem • Speeded category verification task • Participants evaluate item category memberships • Measure both RT and response • Each participant evaluates each item exactly once • Expectation: “Typical” members (e.g., Dog, Cat) are easier
An example problem • The problem • Standard assumptions violated • Bivariate data (RT and binary response) do not conform to the assumptions made by standard models (e.g., normality) • Different sources of variability • RT and response are partly determined by both participants (ability) and items (difficulty)
An example problem • The problem • Standard assumptions violated • Typical problem in mathematical psychology • Approach: use process models
An example problem • The problem • Standard assumptions violated • Typical problem in mathematical psychology • Approach: use process models • Different sources of variability • Typical problem in psychometrics • Approach: hierarchical models (multilevel models; mixed models; e.g., crossed random effects of persons and items)
Wiener diffusion model Process model for choice RT Predicts RT and binary choice simultaneously Principle: Accumulation of information Diffusion model
τ d Evidence a z = ba 0.0 0.125 0.250 0.375 0.500 0.625 0.750 (For persons p, conditions i, and trials j.) time
Diffusion model • Many associated problems • Technical issues • Parameter estimation / Model comparison • Substantive issues • Difficult to combine information across participants • Problem if many participants with few data each • Problem if items are presented only once (e.g., words) • Unlikely that parameters are constant in time (i.e., unexplained variability) • Almost completely descriptive – differences over persons/trials/conditions cannot be explained
Cognitive psychometrics • Use cognitive models as measurement model • Try to explain differences • between trials, manipulations and persons • by regressing the parameters on covariates
Indexes p for persons, i for conditions Cognitive psychometrics • Most common measurement model: Gaussian • Normal linear model (linear regression, ANOVA): • But often not a realistic model • Unsuited for choice RT
Measurement level describes the data Regression component explains differences Transform the parameter(s) to a linear scale Cognitive psychometrics • Common measurement model in psychometrics: Logistic • Two-parameter logistic model (item response theory):
Adding random effects • Not all data points come from the same distribution • Differences between participants/items/… exist, but causes unknown
Adding random effects • Case of the diffusion model’s drift rate
Ratcliff diffusion model Measurement level (Wiener process) Trial-to-trial variability in bias Trial-to-trial variability in information uptake rate Trial-to-trial variability in nondecision time Adding random effects
Adding random effects • Crossed random effects diffusion model
Adding random effects • Addition of random effects • Allows for excess variability • Due to item differences • Due to person differences • Allows to build “levels of randomness” • Importantly, can be accomplished with the diffusion model • Only feasible in a Bayesian statistical framework
Applying to data • Crossed random effects diffusion model Pop. distr. of Mean Stdev item easiness (distractors) item easiness (targets) person aptitude
Explanatory modeling • Previous models were descriptive • Didn’t use covariates • Mixed models merely quantify variability • Use external factors as predictors to • analyze the data • explain the differences in parameter values (i.e., reduce unexplained variance)
Explanatory modeling • Variability in choice RT due to • Inherent (stochastic) variability in sampling • Trial-to-trial differences • Participant effects • Participant’s group membership • Item effects • Item type • Combination of the above • …
Explanatory modeling • Use basic “building blocks” for modeling • Random/Fixed effects • Person/Item side • Hierarchical/Crossed • Use covariates (continuous/categorical/binary)
explaining variability in drift rate Explanatory modeling
Conclusions • Category verification data • Variance in person aptitude small (0.04) relative to variance in item easiness (≈ 0.11) • Item easiness correlates with typicality
Conclusions • More results (not discussed) • Other parameters besides drift rate may be analyzed • e.g., encoding time is negatively correlated with word length (at ±7ms/letter) • Results hold across semantic categories (not just for mammals)
General conclusion • Hierarchical diffusion models • combine a realistic process model for choice and reaction time with random effects and explanatory covariates • allow to analyze complex data sets in a statistically (and substantively) principled fashion with relative ease
Future work • Efficient software for fitting hierarchical diffusion models • Model selection and evaluation methods
Thank you • Questions, comments, suggestions welcome