Download
1 / 13
130 likes | 163 Vues
Learn about the advanced techniques and selected applications of X-ray absorption spectroscopy at GSECARS, including chemical speciation, near-neighbor distances, and coordination numbers. Discover how this world-class micro-beam facility is utilized for various studies.

E N D
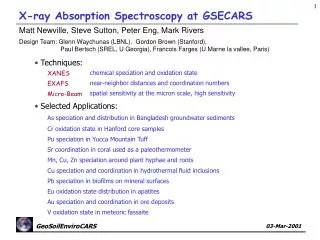
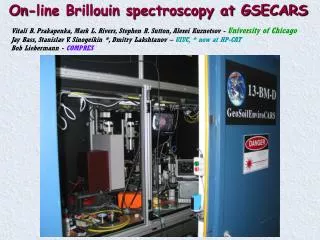
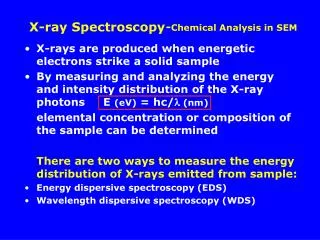
X-ray Absorption Spectroscopy at GSECARS Matt Newville, Steve Sutton, Peter Eng, Mark Rivers Design Team: Glenn Waychunas (LBNL), Gordon Brown (Stanford), Paul Bertsch (SREL, U Georgia), Francois Farges (U Marne la vallee, Paris) • Techniques: chemical speciation and oxidation state XANES near-neighbor distances and coordination numbers EXAFS spatial sensitivity at the micron scale, high sensitivity Micro-Beam • Selected Applications: As speciation and distribution in Bangladesh groundwater sediments Cr oxidation state in Hanford core samples Pu speciation in Yucca Mountain Tuff Sr coordination in coral used as a paleothermometer Mn, Cu, Zn speciation around plant hyphae and roots Cu speciation and coordination in hydrothermal fluid inclusions Pb speciation in biofilms on mineral surfaces Eu oxidation state distribution in apatites Au speciation and coordination in ore deposits V oxidation state in meteoric fassaite
GSECARS Fluorescence and XAFS Microprobe Station Beamline13-ID-C is a world-class micro-beam facility for x-ray fluorescence (XRF) and x-ray absorption spectroscopy (XAS) studies: Incident Beam: Monochromatic x-rays from LN2 cooled Si (111) Sample Stage: x-y-z stage, 0.1mm resolution Fluorescence detector: 16-element Ge detector [shown], Si(Li) detector, Lytle Detector, or Wavelength Dispersive Spectrometer at 90o to incident beam Optical Microscope: (5x to 50x) with external video system Data Collection: Flexible software for x-y mapping, traditional XAFS scans, XAFS scans vs. sample position. Focusing: Horizontal and Vertical Kirkpatrick-Baez mirrors
Kirkpatrick-Baez focusing mirrors The table-top Kirkpatrick-Baez mirrors use a four-point bender and flat, trapezoidal mirror to dynamically form an ellipsis. They will focus a 300x300mm beam down to 1x1mm - a flux density gain of 105. With a typical working distance of 100mm, and an energy-independent focal distance and spot size, they are ideal for micro-XRF and micro-EXAFS. We use Rh-coated silicon for horizontal and vertical mirrors to routinely produce 3x3mm beams for XRF, XANES, and EXAFS.
Cu Fe Mn Zn Metals distribution at Root/Soil Interface Andreas Scheinost, Ruben Kretzschmar (ETH Zurich) Zn-rich Mn-rich stele Fe-rich cortex Cu-rich Metal oxide dust was introduced to a forest topsoil resulting in 5000 ppm Zn and 2500 ppm Cu in the soil. These mXRF maps show the distribution of Zn, Cu, Fe and Mn near a barley root growing in the contaminated soil. Close to a Zn oxide particle, the root is strongly enriched in Zn. Arrows mark regions where Zn m-XAFS spectra were collected. Optical microscope image of root
Zn EXAFS and speciation at Rhizosphere The Zn-rich and Cu-rich areas consist of Zn oxide. The remaining areas lack a strong second shell, and show tetrahedral Zn-O coordination, suggesting that Zn dissolved from the oxide is sorbedby the root cortex and byFe and Mn hydroxides.
Chromium Barium Iron 300 x 300 mm Cr redox in Boreholes below Hanford Waste Tanks Sam Traina, Isao Yamakawa (Ohio State Univ.), Gordon Brown, Jeff Warner, Jeff Catalano (Stanford Univ.) Borehole samples collected from the vadose zone under leaking waste tanks, containing highly alkaline fluids. Radioactive (~10 mCi/g Cs-137) soil sections were embedded in epoxy, and sent for synchrotron analysis during January, 2001. mXRF mapping and Cr XAS were studied at GSECARS, bulk Cr XAS SSRL beamline 11-2, and Cs and Cr XAS at PNC-CAT (APS 20-ID)
Cr redox in boreholes below Hanford Waste Tanks Hanford Soil Chromium Redox State Prelminary analysis of the Cr XANES from a few different core samples shows some variability of the Cr6+ / Cr3+ ,ratio, but fairly significant reduction of Cr6+ to Cr3+. Cr EXAFS measurements are still being processed (but seem to be typical Cr3+-oxide)
Cu 25oC Fe 25oC Cu 495oC Fe 495oC Cu speciation in Hydrothermal Fluid Inclusions John Mavrogenes, Andrew Berry (Australian National University) Understanding the metal complexes trapped in hydrothermal solutions is key to understanding the formation of ore deposits. mXRF and mXAFS are important tools for studying the chemical speciation and form of these fluid inclusions. Cu and Fe-rich fluid inclusions in granites were examined at room temperature and elevated temperatures by XRF mapping and XAFS. Expectation: chalcopyrite precipitate at low temperature would dissolve into solution at high temperature. Result: uniform Cu2+ solution at low temperature, not associated with Fe, and Cu1+ at high temperatures, with a less uniform spatial distribution. 65mm
High Resolution X-ray Fluorescence and EXAFS A complication in measuring fluorescence and EXAFS in many natural samples is the prescence of fluorescence lines from other elements near the line of interest: The resolution of a solid-state fluorescence detector (~150eV) is sometimes not good enough to resolve nearby fluorescence lines The Wavelength Dispersive Spectrometer has much better resolution (~20eV) than a solid-state detector, and a much smaller solid angle. It uses a Rowland circle, not electronics, to select energies of interest. It needs the brightness of an undulator, but complements the Ge detectors, and allows XRF and even EXAFS on systems with overlapping fluorescence lines.
011 vicinal face 011 vicinal face 001 vicinal face Sector Zoning of Rare Earth Elements in Apatites John Rakovan (Miami University) . Apatites have a high affinity for Rare Earth Elements (REE), and are often used to study petrogenesis. Heterogeneities in crystal surface structure during apatite growth can strongly alter REE incorporation. Most REEshow sectoral zoning in apatite based on ionic size. Ions larger than Ca2+ (La3+) preferring growth along the 001 face, and those smaller than Ca2+ (Sm3+) preferring the 011 face Eu is the only REE showing no zonation, but it has two valence states and two ionic sizes that straddle the size of Ca2+. Is there a partitioning of Eu based on valence state/ionic size?
Sector Zoning of Rare Earth Elements in Apatites Since Eu has two valence states with different ionic sizes (Eu2+ / 1.2 Å, Eu3+ / 1.3 Å), it was suggested that there may be a valence/ionic size variation in different growth zones. The bad news: There is way too much Mn in the apatite to separate from the Eu fluorescence line with a solid state detector. . Using the high resolution WDS and the microprobe, we measured the Eu XANES on several spots in the different sectors, and across a <011> / <001> boundary. X-ray counts Result: We see almost no change at all in Eu2+ / Eu3+ across the zone boundary: the ratio is ~17% Eu2+ throughout the apatite. Energy (keV)
Eu sorption on Fe/Cr oxides Chia Chen, Sam Traina (Ohio State Univ.) . The local structure and coordination chemistry of sorbed species at mineral-water interfaces greatly influence their stability -- XAFS plays a key role in understanding the interactions interactions between sorbent and surface. The sorption of Eu on minerals such as Fe-and Cr-oxides is especially relevant to DOE concerns, as Eu is a common fission product and a chemical analog of Am. Several model Eu on Fe/Cr oxide sorption samples were made to determine the local structure of sorbed Eu as a function of Cr concentration, pH, and sample aging. c(k) x k3 There is way too much Fe/Cr for a solid-state detector. The Eu LIII edge can’t be used: it gives only 150 eV of EXAFS before the Fe K-edge These EXAFS measurements were made with the Eu LII edge, monitoring the Eu Lb fluorescence line with the Wavelength Dispersive Spectrometer. Bulk EXAFS that requires an undulator.
Eu sorption on Fe/Cr oxides: Results . Eu are sorbed to the Fe/Cr oxide surfaces. Cr substitution for Fe does not impact the sorbed Eu surface structures. No significant aging effects were seen.