
Do Now
Learn how to solve and graph compound inequalities, analyze graphs representing various situations, and sketch graphs for discrete and continuous scenarios.

Do Now
E N D
Presentation Transcript
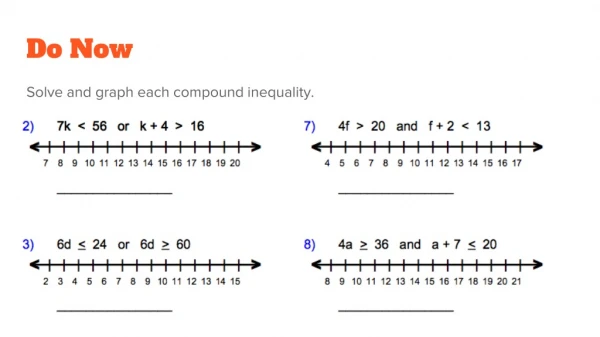
Do Now Solve and graph each compound inequality.
Quiz Time! Please turn in your homework packet.
3.1 Graphing Relationships The distance a delivery van is from the warehouse varies throughout the day. The graph shows the distance from the warehouse for a day from 8:00 am to 5:00 pm. • Segment 1 shows that the delivery van moved away from the warehouse. What does segment 2 show? • Based on the time frame, what change in the distance from the warehouse is represented by segment 6?
C. Which line segments show intervals where the distance did not change? D. What is a possible explanation for these segments?
Example Three hoses fill three different water barrels. A green hose fills a water barrel at a constant rate. A black hose is slowly opened when filling the barrel. A blue hose is completely open at the beginning and then slowly closed. The three graphs of the situations are shown.
Example 1 Questions • Which graph best represents the amount of water in the barrel filled by the green hose? • Describe the water level represented by each graph. Then determine which graph represents each situation • Could a graph of the amount of water in a water barrel slant downward from left to right? Explain.
Your Turn You and a friend are playing catch. You throw three different balls to your friend. You throw the first ball in an arc and your friend catches it. You throw the second ball in an arc, but this time the ball gets stuck in a tree. You throw the third ball directly at your friend, but it lands in front of your friend, and rolls the rest of the way on the ground. The three graphs of these situations are shown.
Questions for Your Turn • Which graph represents the situation where the ball gets stuck in the tree? • Describe the height of the ball represented by the other two graphs
Sketching Graphs for Situations Some graphs that represent real-world situations are drawn without any interruptions. In other words, they are continuous graphs. A continuous graph is a graph that is made up of connected lines or curves. Other types of graphs are not continuous. They are made up of distinct, unconnected points. These graphs are called discrete graphs.
Example Sketch a graph of the situation, tell whether the graph is continuous or discrete, and determine the domain and range. A student is taking a test. There are 10 problems on the test. For each problem the student answers correctly, the student received 10 points. The graph is made up of multiple unconnected points, so the graph is discrete. The student can get anywhere from 0 to 10 questions right, so the domain is the whole numbers from 0 to 10. If the student gets 0 problems correct, the student gets 0 points. If the student gets 10 problems correct, the student gets 100 points. So the range is whole number multiples of 10 from 0 to 100.
Another Example A bathtub is being filled with water. After 10 minutes, there are 75 quarts of water in the tub. Then someone accidentally pulls the drain plug while the water is still running, and the tub begins to empty. The tub loses 15 quarts in 5 minutes, and then someone plugs the drain and the tub fills for 6 more minutes, gaining another 45 quarts of water. After a 15-minute bath, the person gets out and pulls the drain plug. It takes 11 minutes for the tub to drain. Is the graph continuous or discrete? What’s the domain? What’s the range?
Your Turn Sketch a graph of the situation, tell whether the graph is continuous or discrete, and determine the domain and range. • At the start of a snowstorm, it snowed two inches an hour for two hours, then slowed to one inch an hour for an additional hour before stopping. Three hours after the snow stopped, it began to melt at one-half an inch an hour for two hours. • A local salesman is going door to door trying to sell vacuums. For every vacuum he sells, he makes $20. He can sell a maximum of 10 vacuums a day


