Characteristics and Ecology of Tropical Savannas
400 likes | 447 Vues
Explore the unique features and ecological constraints of tropical savannas, from the diverse flora to stress factors like drought, nutrients, fire, and herbivory. Learn about the seasonal dynamics, woody species, legumes, and environmental stressors shaping these biodiverse ecosystems.

Characteristics and Ecology of Tropical Savannas
E N D
Presentation Transcript
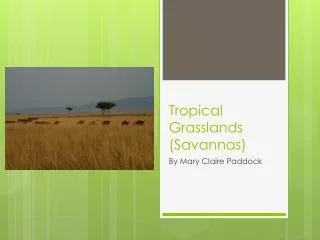
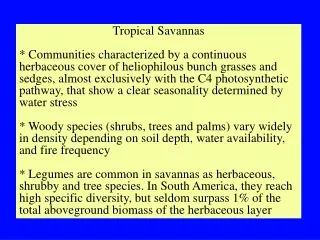
Tropical Savannas * Communities characterized by a continuous herbaceous cover of heliophilous bunch grasses and sedges, almost exclusively with the C4 photosynthetic pathway, that show a clear seasonality determined by water stress * Woody species (shrubs, trees and palms) vary widely in density depending on soil depth, water availability, and fire frequency * Legumes are common in savannas as herbaceous, shrubby and tree species. In South America, they reach high specific diversity, but seldom surpass 1% of the total aboveground biomass of the herbaceous layer
Tropical Savannas • Distribution: Tropical and subtropical vs temperate grasslands Intercontinental differences 2. Stress factors: water, nutrients, fire and herbivory 3. Physiognomic diversity and tree density 4. Savannas as an ‘underground” ecosystem 5. The grasses: Productivity Effect of fire Nutrient requirements 6. The trees Evergreen vs. deciduous 7. The legumes Significance of symbiosis: Rhizobia and mycorrhiza
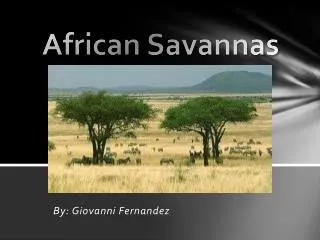
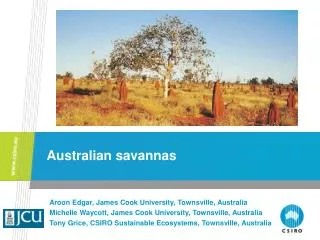
Intercontinental Similarities and Differences * The grass layer is highly homogeneous in physiognomy, morphology and function * The woody components vary in their phenology and structure according to relative water and nutrient availability - In Africa most woody components are drought deciduous, (with the exception of a few species in western Africa), - Most shrubby and tree species in Australia and South America are evergreen, changing their leaves during the dry season. - Most woody species in Australia and South America are scleromorphic due to the abundance of mechanical tissue and silica, while typical African tree species are mesophyllous in structure
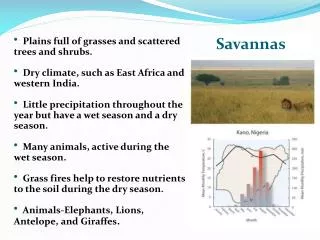
Tropical savannas are stress dominated systems • Seasonal drought • Rainfall seasonality with interannual variations in amount of rainfall, • duration of the rainy season (Rainfall > Evaporation), and • beginning of the rainy season • Seasonal but unpredictable occurrence of fires • - Affects mineralization of aboveground biomass • - Influences vigour of resprouting of grass and woody perennials • - Late or too early fires during the dry season are deleterious for plant activity • due to utilization of soil water and burning of new foliage of woody perennials • Seasonal selective herbivory • Main impact during the growing season, leads to a variable reduction in • productivity and reproductive capacity. • Generally low soil nutritional status • - Low availability of P, K and Ca • - Productivity depends on nitrogen mineralization • - Nitrogen accumulation in soil is affected by fire frequency • Mineralization pulses at the beginning of the rainy season synchronized with • vegetation activity
Ecological constraints typical of lowland savanna environments (modified from Sarmiento 1992) Environmental variable Physiological stress Constant high irradiation Photoinhibition (midday 1500-2000 µmol m-2 s-1) Water stress Constant high air temperature Water stress (midday 25-32ºC) Increased respiration Constant high evaporative demand Water stress (midday leaf/air VPD= 2-3 kPa) Reduced CO2 uptake Seasonal drought Water stress (2-7 months soil Y < 1.5Mpa) Leaf area reduction, Nutrient deficiency Low nutrient availability Nutrient deficiency, (∑bases= 0.1-5 cmol kg-1; Reduced protein synthesis N= 0.1-0.15 %; pH= 4.5-5.5) Fire Reduction of leaf area (annual frequency: 0.3, 0.5, 1) Nutrient losses from system (N2)
Changes in vegetation density and woody/grass ratios along a rainfall gradient in southern Africa (Walter 1973) Increasing Rainfall (≈ 400-1000 mm)
Life-form spectra for several savannas, according to the Raunkiaer system • (Sarmiento and Monasterio 1983) • Locality Phanerophytes Chamaephytes Hemicryptophytes Geophytes Therophytes • Zaire, Lake Edward 5 38 22 5 29 • plains: mean of 2 savannas • Lebrun (1947) • Nigeria, Olokemeji 30 0 23 21 25 • savanna site • Hopkins(1962) • Ivory Coast, Lamto; 9 1 62 9 19 • mean of 8 savannas • Southwest Madagascar; 21 18 26 3 32 • mean of 11 savannas • Morat(1973) • Northern Surinam; 8 3 38 28 23 • total savanna flora • Van Donselaar-Ten Bokkel • Huinink (1966) • Central Venezuelan 28 7 3 1 5 29 • savanna flora of Calabozo • Aristeguieta (1966) • Western Venezuelan 11 3 18 40 28 • Ilanos, savannas of Barinas • Sarmiento (unpublished)
P/N relationships in grass leaves (Trachypogon vestitus and Axonopus cancescens) from plots cut or burned, with or without fertilization. , cut (control); burned (control); cut + NK; burned +NK; cut +PK; burned +PK. Group a: green leaves of control and NK treatments Group c: green leaves of PK treatments Group b: dead leaves of the NK treatments Group d: dead leaves of the PK treatments a c d b
Effect of fertilization on above ground biomass production in Trachypogon savannas of Central Venezuela (calculated from curves in San José and García-Miragaya,1981). Fertilizer 100 kg ha-1 of N, P and K Treatment Peak Biomass Nitrogen % Increase g m-2 mg g-1 Biomass N Control 222 5.3 --- --- N 250 6.1 13 15 NK 247 6.3 11 19 NP 313 7.4 41 40 NPK 373 7.3 68 38 Phosphorus % Increase mg g-1 Biomass P Control 223 0.51 --- --- P 263 1.50 18 194 PK 280 1.19 26 133 PN 314 1.88 41 269 PNK 372 1.85 67 263
Increase in biomass and nitrogen and phosphorus content of biomass of fertilized grasslands in Calabozo, Venezuela (García-Miragaya et al. 1983), South Africa (Hall et al. 1943), and Katherine, Australia (Norman 1966) Site Biomass % Incr. N % Incr. P % Incr. g m-2 mmol kg -1 mmol kg-1 Calabozo Control 222 379 16 Venezuela N + P 313 41 529 40 61 269 South Africa Control 1908 779 25 N + P 2547 34 900 16 49 96 Katherine Australia Control 216 243 7 N + P 442 105 257 6 15 96
MAXIMUM STOMATAL CONDUCTANCE (gs) AND MINIMUM LEAF WATER POTENTIAL (min) AND OSMOTIC POTENTIAL () AT FULL TURGOR MEASURED IN LEAVES OF DIFFERENT DEVELOMENTAL STAGES Species (leaf type) Maximum gs (cm s-1)amin ( Mpa) (MPa) ∆ Curatella americana Expanded soft 0.540 0.90 1.12 0.20 Mature 0.595 l.13 2.75 1.62 Byrsonima crassifolia Expanded soft 0.650 1.39 1.45 0.06 Mature 0.625 1.27 1.50 0.23 Bowdichia virgilioides Expanded soft 0.645 0.92 1.21 0.29 Mature 0.750 1.41 1.42 0.01 Casearia sylvestris Expanded soft 0.370 1.65 1.59 -0.06 Mature 0.370 2.01 2.14 0.13 Data from Meinzer et al. (1983). a. Estimated from published curves
Nutrient concentrations of leaves and roots of legume species in natural savannas (the dashed line indicates the sufficiency concentrations for cultivated legumes)
Comparative values of leaf nutrient levels of legumes and grasses growing under natural conditions in Trachypogon-savannas in Venezuela compared to critical levels of cultivated pastures. Average values followed by standard deviations in parenthesis Species N P K LEGUMES Wild species (n=22) 18.1 (4.9) 0.62 (0.30) 5.1 (2.4) (1) Critical levels for cultivated species (n=8) ca. 20.0 2.11 (0.03) 6.6 (2.3) (2) GRASSES Trachypogon-savanna (n=2) 8.9 (1.5) 0.76 (0.07) 5.5 (1.8) (3) Critical level for cultivated species (n=3) 9.9 (3.2) 0.82 (0.43) 6.8 (0.9) (4) (1) Medina and Bilbao 1991; (2) Andrew and Robins 1969a,b); (3) Medina et al. 1978; (4) Malavolta et al. 1974
Average nitrogen concentration and 15N values of the savanna sites investigated In each column numbers followed by the same letter are not statistically different (P≤0.01) SOILS LEGUMES NON-LEGUMES Average ∆ (15N plant-soil) Site (n) N 15N (n) N 15N (n) N 15N Legumes Non-Legumes mg g-1 ‰ mg g-1 ‰ mg g-1 ‰ ‰ Mata Negra 8 0.8a 2.8a 11 23.1a -1.2a 10 8.7a 2.4a -4.0a -0.4 a Urica 2 0.6a 4.5a 5 24.8a -1.1a 2 8.8a 3.1a -5.6b -1.4a,b La Iguana 24 1.3b 5.2b 17 20.8a -0.8a 18 7.3a 3.1a -6.0b -2.1 b Legumes vs non-legumes STATISTICS N 15N ∆ (15N plant-soil) Mata Negra P<0.001 <0.001 <0.001 Urica P<0.001 <0.001 0.018 La Iguana P<0.001 0.02 <0.001
Take Home Messages 1. Savanna physiognomy is determined by a combination of environmental constraints (seasonal drought; soil nutrient limitations) and disturbance regimes (fire; herbivory) 2. Savanna ecosystems are characterized by a predominance of hemicryptophytes and geophytes, possibly selected by frequency of fire disturbance 3. Tree species in Southamerican savannas are evergreen, frequently changing their foliage during the middle and the end of the dry season. Grass photosynthetic canopy is strongly seasonal and frequently burns during the dry season 4. Grasses posses predominantly the C4-photosynthesis pathway, and dominate not only seasonal but also flooded (hyperseasonal) savannas 5. Productive capacity of trees and grasses appears to be limited by N supply, while legumes are more limited by P supply and possibly micronutrients related to the N2-fixation process 6. C4-photosynthetic types in grasses (NADP-Malic Enzyme; NAD-Malic Enzyme and PEP-Carboxyquinase) differ in their N requirements, aspartate-formers being favored by higher N-availability 7. Savanna legumes are strongly dependent on mycorrhizal associations for nutrient uptake (P) and N2-fixation capability of the root-Rhizobium associtations. The occurrence of “tripartite” associations (roots-Rhizobia-mycorrhiza) appears to be indispensable for savanna ecosystem function