Download
1 / 15
150 likes | 164 Vues
Join the NASA Biodiversity and Ecological Forecasting Team Meeting to discuss the threats to biodiversity, the importance of biodiversity conservation, and the integrated framework for monitoring and modeling biodiversity. Explore the role of NASA in understanding and managing the components of the living world.

E N D
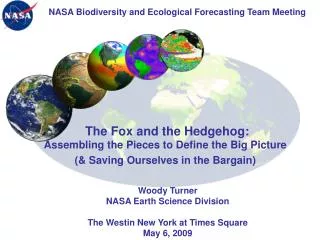
NASA Biodiversity and Ecological Forecasting Team Meeting The Fox and the Hedgehog: Assembling the Pieces to Define the Big Picture (& Saving Ourselves in the Bargain) Woody Turner NASA Earth Science Division The Westin New York at Times Square May 6, 2009
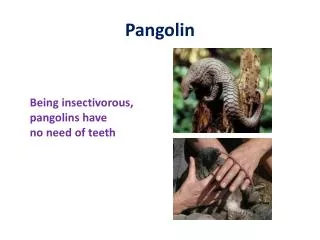
The fox knows many things; the hedgehog one great thing. Archilochus(680-645 BC) (Photo: Phil Myers, Museum of Zoology, University of Michigan )
Biodiversity in Crisis • Of the higher taxa monitored by the IUCN, seeing high percentages of species threatened • WWF Living Planet Index shows declines in abundances of tracked terrestrial, marine, & freshwater vertebrate species • Threats to biodiverse ecosystems around the globe (hotspots, etc.) • Higher human population growth around PAs in Africa & Latin America (Wittemyer et al. in Science, 2008) • Loss of evolutionary potential (Smith & Bernatchez in Molecular Ecology 2008) • Losses evident at all levels: ecosystems, species, molecular • Is this important? If so, what do we do? The beauty and genius of a work of art may be reconceived, though its first material expression be destroyed; a vanished harmony may yet again inspire the composer; but when the last individual of a race of living beings breathes no more, another heaven and another earth must pass before such a one can be again. William Beebe, The Bird, 1906(from Wikiquote)
The Grand Paradox • Some have called the 21st Century the Age of Biology in which the marriage of Molecular Biology & Ecology opens the doors of biology and life to us in all its grandeur • As Lavoisier, Priestley, & colleagues did for chemistry in the 18th Century resulting in the Industrial Revolution in the 19th Century & Einstein & colleagues did for physics in the 20th Century partly underpinning the Information Age • Juxtapose this potential against our the ongoing loss of the elements of biology (Biodiversity) & our woeful ignorance of the components of the living world, which are admittedly vast in number & complexity
Our Ignorance Is Great; But Not too Great to Start (http://ccinfo.ims.ac.jp/periodic/periodic.jpg)
Thinking Like a Hedgehog • What do we need to reduce our ignorance & simultaneously enable us to take responsibility for (i.e., manage as if they mattered) the living organisms, ecosystems, & their component parts (i.e., the biodiversity) of our planet? An integrated framework to observe, understand, & monitor the condition of biodiversity over time & model its future condition Tracking Change & Modeling the Future
Network of NetworksAn Approach for Connectivity & Synthesis across Scales
Elements of the Big Picture • Monitoring • Observations integrated across scales (genes to organisms/individuals to ecoregions)--organized, directed, repeated (satellites, microsatellites, camera traps, mini-cams, sonar, telemetry, soundscapes/biophony, etc.) • Modeling • Fusion of statistical & mechanistic (correlative & process) distribution models with population models = place & number, employing ensemble techniques, frameworks for downscaling, & linkage over the Web • Regionalization • Hubs & spokes with connections across hubs • Advantages of scale, ecological similarities, existing networks, etc. • Participation • Web 2.0 = 2-way information flow, social networks, involvement, e.g.: cell phones as RS tools, National Phenology Network • Presentation • Challenge: present tabular data in a geospatially & visually meaningful way, content: photos, videos, talks, recordings of calls, YouTube Nature
What Role for NASA? • Focus on our strengths • We are: • a Space Agency • Top-down, synoptic view; providing context; global reach • Must involve satellite imagery or related products • a Research & Development Agency • Introduce new technologies; focus on the potential • Not an “operational” agency; demonstrate the cutting edge & move on • a US Federal Government Agency • Ties to other USG agencies & other Governments • Cannot compete with the private sector • Partnerships are imperative!
Global Biodiversity Monitoring Network Regional Programmes Global Programmes Regional monitoring- selected habitats (e.g. wetlands) Global sampling of indicator taxa at 2-5 year intervals Regional monitoring-locally relevant taxa Global land- cover maps at 5- year intervals Monitoring (Courtesy R. Scholes 2008 with help from R. Noss) (From Pereira & Cooper in TREE 2006)
Modeling When the JNWPU (Joint Numerical Weather Prediction Unit) was organized (1954) there were two ways it could have gone. One was to study the mechanics of the atmosphere, to look for tools to be used by forecasters, and at the same time to develop and ultimately demonstrate the utility of NWP (numerical weather prediction) as an operational product in itself. The second was to proceed immediately to operational NWP production. The JMC (Joint Meteorology Committee) directed JNWPU to pursue the latter course. As it turned out, this was based on false optimism about the short term, but had the decision been otherwise, the effort would likely have failed (emphasis added). The operational environment was the appropriate environment for the early problems to be quickly encountered and solved. A substantial portion of the resources of the nation’s weather services were being devoted to the effort; the necessary support could not be long sustained without significant positive results. (F. Shuman, 1989) Can we generate community organismal and ecosystem distribution and abundance models building upon NWP and climate system modeling experience (e.g.: Community Climate System Model(s))? (Frederick Shuman, 1989)
Regionalization CATHALAC Latin America RCMRD East Africa Current Links Future Links SERVIR Coordination Office NASA/MSFC Future Central Asian Node Future West Africa Node (From The Northeast Bird Monitoring Handbook, J.D. Lambert et al. 2009)
Presentation • April 2, 2009: free Landsat data downloads hit 500,000 for FY09--prior to policy change making Landsat data freely available on the Web, the highest yearly distribution of scenes was ~25,000 • Can explore the “MODISization” of Landsat & other data sets • But still, what does a Biodiversity layer look like? • How can we visually better present tabular data? • A Mashup Challenge?
Bretherton et al.’s System Diagram (A Previous NASA Catalyst) (From: Earth System Science: A Closer View (1988))