Download
1 / 50
500 likes | 615 Vues
Synthetic plots: history and examples David R. Brillinger Statistics Department University of California, Berkeley www.stat.berkeley.edu/~brill brill@stat.berkeley.edu. SECTIONS. Model appraisal methods II. Synthetic plots

E N D
Synthetic plots: history and examples David R. Brillinger Statistics Department University of California, Berkeley www.stat.berkeley.edu/~brill brill@stat.berkeley.edu
SECTIONS • Model appraisal methods • II. Synthetic plots • III. Spatial p.p. – galaxies • IV.Timeseries – river flow • V. Spatial-temporal p.p. - wildfires • VI. Trajectories – seals, elk • VII. Summary and discussion • ?. Explanatories
MODEL APPRAISAL • Science needs appraisal methods • Cycle: • Model construction <--> model appraisal • Is model compatable with the data? • Classical chi-squared (df correction) • The method of synthetics • Neyman et al
II. SYNTHETIC PLOTS Simulate realization of fitted model Put real and synthetic side by side Assessment Turing test? Compute same quantity for each?
III. SPATIAL P. P. - galaxies Neyman, Scott and Shane (1953) On the spatial distribution of galaxies …Astr J, 117, 92-133
“… Figure 1 was constructed assuming …, the Poisson law ….”“… it was decided to produce a synthetic plot …”“When the calculated scheme of distribution was compared with the actual distribution of galaxies recorded in Shane’s photographs of the sky [see page 192], it became apparent that the simple mechanism could not produce a distribution resembling the one we see. In the real universe there is a much more pronounced tendency for galaxies to be grouped in clusters.”
Neyman, Scott & Shane (1954) On the index of clumpiness …Astr. J. Suppl. 1, 269-294. “In the third paper …, it was shone that the visual appearance of a ‘synthetic’ photographic plate, obtained by means of a large scale sampling experiment conforming exactly with the assumptions of the theory, is very similar to the actual plate. The only difference noticed between the two is concerned with the small-case clumpiness of images of galaxies.”
In summary: Data {(xj,yj)}, spatial point process 1.Poisson rejected (visually) 2. Clustering (Neyman-Scott process) rejected (visually) 3. More clustering Detail: counting error, variation in limiting magnitude
Results – Scientific American 1956 Turing test?
IV. TIME SERIES – Saugeen River Average monthly flow 1915 – 1976 Walkerton
Data: {y(t)}, time series Hippel and McLeod Periodic autoregression (PAR) Stack years - 62 by 12 matrix (Buys-Ballot) AR(1): Xij = ρjXi,j-1+εij Nonstationary Fit, generate synthetic series
Comparison Spectral ratio
Risk analysis Pixel model, {(xj,yj,tj)} logit P{Nxyt = 1} = g1(x,y)+g2(<t>)+h[t] (x,y): location, <t>: day, [t]: year, g1, g2 smooth Sampled 0’s
Original and Bernoulli simulation Turing test?
Comparisons Nearest neighbour distribution
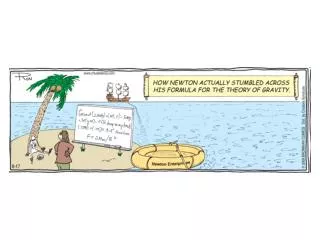
DEs. Newtonian motion Scalar potential function, H Planar case, location r = (x,y)’, time t dr(t) = v(t)dt dv(t) = - βv(t)dt – β grad H(r(t),t)dt v: velocity β: coefficient of friction dr = - grad H(r,t)dt = μ(r,t)dt, β >> 0
Examples of H. Point of attraction H(r) = .5*σ2 log r – δr Point of repulsion H(r) = C/r Attraction/repulsion H(r) = α(1/r12 – 1/r6) General parametric H(r) = β10x + β01y + β20x2 + β11xy + β02y2 Nonparametric spline expansion
SDEs. dr(t) = μ(r(t),t)dt + σ(r(t),t)dB(t) μ: drift, –grad H σ: diffusion {B(t)}: bivariate Brownian
Data: {(x(tj),y(tj)),tj)} Solution/approximation. (r(ti+1)-r(ti))/(ti+1-ti) = μ(r(ti),ti) + σ(r(ti),ti) Zi+1/√(ti+1-ti) Euler scheme Approximate likelihood Boundary, startup effects
Fitted potential: general parametric attraction & repulsion
Synthetic Turing test?
Comparison Bagplot cp. Boxplot centre is bivariate median “bag” contains 50% with greatest depth fence – inflate bag by 3 Rousseuw, Rutts, Tukey (1999)
TRAJECTORIES – elk/wapiti Rocky Mountain elk (Cervus elaphus) Banff Starkey Reserve, Oregon Joint usage possible?
Data: {(x(tj),y(tj)), tj)} 8 animals, Δt = 2hr Foraging, resting, hiding, … Model. dr = μ(r)dt + σdB(t) μ smooth – geography velocity field
Boundary (NZ fence) dr= μ(r)dt + σ(r)dB(t) +dA(r) A, support on boundary, keeps particle constrained Synthetic paths. If generated point outside, keep pulling back by half til inside
Comparisons Distribution of distances to “centre”
VII. SUMMARY & DISCUSSION Synthetic plots: method for appraising complex data-based models via Monte Carlo Criteria: EDA, formal Four examples: time series, spatial-temporal p.p., trajectories Found inadequacies in each case
Corrections like Pearson’s for chi-squared Difficulties: land mask irregular times large time differences simulations based on same data
Acknowledgements. Aager, Littman, Preisler, Stewart NSF, FS/USDA
REFERENCES E. Nelson (1967). Dynamical Theories of Brownian Motion. Princeton H. S. Niwa (1996). Newtonian dynamical approach to fish schooling. J. theor. Biol.
Part B. Experiment with explanatory Same 8 animals ATV days, Δt = 5min