Download
1 / 201
2.03k likes | 2.68k Vues
Directorate Of Economics of Statistics, BIHAR. . Directorate of Economics & Statistics Bihar. Genesis of the Directorate Before independence, Agriculture Statistical Organization under the Revenue Department.

E N D
Directorate Of Economics of Statistics, BIHAR.
Directorate of Economics & Statistics Bihar
Genesis of the Directorate • Before independence, Agriculture Statistical Organization under the Revenue Department. 2. Directorate of Economics & Statistics under the control of Finance Department in 1949. 3. Agriculture Statistical Organization & The Evaluation Organization of Rural Reconstruction Department was merged in this Directorate in 1964. The Directorate was renamed as Directorate of Statistics & Evaluation.
4. The Directorate of Statistics and Evaluation came under the administrative control of Planning and Development Department in 1968. 5. Directorate of Evaluation was created and the organization was renewed DES in 2009.
II. Glorious PastPioneer state to (a) Set-up statistical organization (b) Compile SDP for 1948-49. (c) Compile consumer price index number.(d) Start-up statistical function up to Block Level Initiation by Mahalanobis for Crop Cutting Experiment during1943-44.
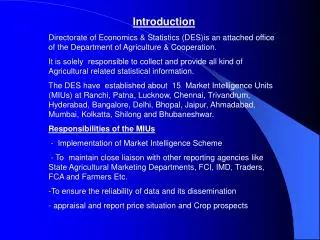
III. Current Activities of the Directorate • Directorate plays a vital role in the matter of collection, compilation and interpretation of data pertaining to different sectors of state economy. The major divisions of the DES Bihar are as follows :- • Agriculture • Economic Statistics • Building Statistics • Civil Registration • Training & Publication • Ad-hoc Survey and Census
The activities performed by DES, Bihar are related to • CSO • NSSO • RGI • Directorate of Economics and Statistics (Min. of Agr.) • NBO (National Building Organization) • Indian Meteorological Department etc. More than one Directorates are performing these activities in the Center as well as the other states.
DSE Bihar is currently engaged in ten core statistics (identified by the CSO .These are -: 1. SDP Estimates. 2. Estimates of capital formation of savings (partially) 3. Estimates of DDP 4. Estimates of contribution of local Bodies (partially) 5. index of industrial Production (partially) 6. Crop area and production statistics . 7. Whole sale price index. 8. Consumer price index. 9. Birth & Death Registration. 10. Participation in the NSS.
Ten out of twenty core statistics, currently done by Line Deptt. Bihar are :- 1. Major fiscal data : Finance Deptt. 2. Annual Survey of Industries : Not done 3. Health, Morbidity and family welfare statistics : Health Deptt. 4. Education and Literacy Statistics : Edu. Deptt. • Literacy Rate • Enrolment Data 5. Labor and Employment Statistics : Labour & Emp. Deptt. • Labor Statistics • Employment Statistics
Housing Statistics ( not being done as per central norm) : Housing Board & Rural Dev. Deptt. • Electricity Production and Distribution Statistics : BSEB • Forestry Statistics & Water Supply and Sanitation Statistics : PCCF,PHED 9. Transport Statistics • Motor Vehicle Registration : Transport Deptt. • Road Length : PWDDeptt. • Road Accidents : Police Deptt. • Passenger and Goods Traffic : Not done • Statistics for local Area Planning : Not done (urban and rural local bodies)
DES Bihar is not involved in collection of monitorable Statistics pertaining to flagship schemes of the Government of India or the Government of Bihar.
Reliability and accuracy The reliability and accuracy indicators that are prescribed by IMF . These are:-
Adequate basis of the source/field data to compile statistics in terms of adequacy,comprehensiveness,approxima-tion to definition, and timeliness • Regular assessment of source data for coverage, sample error, response error, and non sampling error • Use of sound statistical techniques in data compilation and statistical analysis • Assessment and validation of intermediate data and statistical outputs
5. Tracking of revisions They have assigned the highest rank to (1), (2), and (4) above. This may be termed as threshold quality indicators. Three and five above have been assigned low values. The quality of statistical output has been classified in three qualitative categories-high, medium, and low-in terms of the extent to which the three threshold indicators are satisfied. They have used the following normative scale to assess quality: High Quality: All the components of the threshold indicators are met plus any one of (3) and /(5) Medium Quality: The three threshold indicators are met Low Quality: The threshold indicators are not met.
QUALITY OF STATISTICAL ACTIVITIES STATISTICAL ACTIVITIESI. High Quality • Data on major fiscal variables. • Electricity Production & Distribution. • Education Literacy Statistics . • Transport Statistics: Vehicles Registration, Road Length
STATISTICAL ACTIVITIESII. Medium Quality 1. Crop Area Statistics.
STATISTICAL ACTIVITIESIII. Low Quality • State Domestic Product. • Estimates of contribution of Local Bodies. • Crop Production Statistics. • Education: Institutional Statistics. • Education: Enrollment Data . • Compilation Of CPI.
STATISTICAL ACTIVITIESIII. Low Quality 7. Birth & Death Registration. 8. Labour & employment 9. Forest Statistics. 10. Water Supply and Sanitation. 11. Health, Morbidity and Family welfare Statistics. 12. Transport Statistics: Road Accident.
Details of the activities are as under :- Agriculture Statistics • The Directorate of Statistics and Evaluation is the State Agriculture Statistics Authority (SASA) by the Min. of Agriculture, GOI. Primary workers for this work is Revenue karamchari.An Agriculture Year(July-June) is divided into four seasons:-. - Bhadai - Aghani - Rabbi & - Garma. • Revenue Karamchari has to perform plot to plot survey regarding crop area, irrigated area in the specified format i.e. Jinswar and report it to Circle Office and that report is transmitted to the State Headquarters through the District Statistical Office.
For Estimation of crop production two systems are prevailing • 1. Eye Estimatiion (performed in 5% villages for all the crops.) • 2. Crop cutting Experiment (On 19 crops, 5 fruits & 9 vegetables). • Eye Estimation work is done by the Revenue karamchari and crop cutting Experiments are conducted by CI, BAO, & BSS.
Inspecting agencies for Area Enumeration are DM, Addl.Collector, SDO. DCLR, AO, CO,BDO, ASO, BAO, CI, BSS. Crop Cutting Experiments are also supervised by these Officials GOI has also introduced TRS for conduct of crop survey in 20% villages during first 10 days of the prescribed survey period and ICS for inspection of Area Enumeration , Khesra Totaling and CCE-which is done by the supervising staff of the Directorate & NSSO
The Directorate releases - Final estimate of 33 crops including 14 horticulture crops - Fully revised estimate of 39 crops - 71 Forecast of 39 Crops (1st forecast 24, 2nd forecast 8, final forecast 39) - Farm Price - Land Utilization - Agricultural labour wages - Season wise TRS Estimates for 16 crops
- Source-wise net irrigated area - Crop-wise irrigated area - Index of Area Production & Productivity • Crop-Insurance Scheme- It provides yield-rate of different insured crops to Agriculture Insurance Company.
Rain-Fall • Rain-fall is an important indicator for assessing crop condition. There are 402 approved sites for rain-gauge stations. Out of these 352 are functional . • Daily rainfall data is available in the Directorate over a long period (from 1901).
For conduct of these works following statistical personnel has been posted. • DSO is Overall in charge in 38 districts, but is posted in only 12 districts • BSS in 402+70 blocks out of 534 blocks, but posted in 289 blocks only • One ASO has to perform Agriculture Statistics work for five blocks (on the basis of 402 blocks) but only 12 % ASO are posted.
Against the Sanctioned post of 235 JFI in the various districts and headquarter only 51 posts are filled up. • More than 50 percent post of primary workers are vacant.
State & Districts Domestic Product • Directorate estimates the SDP for the State. • The estimates are released as per the guidelines and time frame fixed by the CSO, GOI. Bihar has released final Estimate for 2006-07 & provisional estimate for 2007-08, quick estimate for 2008-09 & Advance estimate for 2009-10 on current and 1999-2000 prices. • Bihar is also estimating District Domestic Product (DDP). It has released DDP for 2006-07
Economic & Miscellaneous Statistics – Under this head, following works are being done:- • NSSO • SDP/DDP • Budget analysis • Resources • Regional Accounts • Price Statistics • Annual Survey of Industries • Municipal Accounts • Housing Statistics • Jail Statistics
NSS 17th National sample survey inspectorate are functional each with one inspector & 2-4 investigators under the concerning District Statistical Offices. • DES participated in the NSSO surveys. • Analyze data up to 50th round but stopped thereafter • Again tabulate for 61th round & currently engaged in tabulation of 67th round. • Currently engaged in 68th round survey.
Budget Analysis • Directorate has been preparing Economic and purpose classification of the budget document in the format prescribed by the Central Statistical Organization. Economic classification helps to get a clear idea of • Capital Formation out of budgetary resources • Saving of the Govt.
Govt. Contribution to the generation of State Income. Whereas purpose classification indicate the purpose for which expenditure was made such as health, education, social services, Housing etc. Directorate has released Budget Analysis for 2009-10 (AC), 2010-11(RE) & 2011-12 (BE).
Price Statistics - Wholesale and Retail Price of Agriculture commodity collected from 51 centres. - Monthly whole Sale Price Index (WPI) of Agriculture commodities - Monthly Consumer Price Index (CPI) of Industrial Workers (Base- 1939) .Base year charge to 2010 under process. - Monthly Report of Salt Price (Price and availability)
DSE has – • Published Indices up to June 2009 • Introduce new system of Wholesale and Retail Price collection of the Agri. Commodities. • Change base year in consonance with the national norm for CPI of Industrial Workers in the relevant centers.
Index of Industrial Production • The Directorate has to prepare the index of industrial production. For this the basket items and weighing diagram for base year 2004-2005 has already been taken-up .
Miscellaneous Statistics - Jail Statistics - Statistics related to Urban Local Bodies - Wages of Agr. Labourers - Building Statistics - Medical Statistics
Vital Statistics • Directorate is the statutory body executing Registration of Birth & Death under the R B D Act-1969 and State Rules 1999. • Under the Act all Urban bodies and Panchayats are declared as registration units. Besides, Medical College & Hospitals, District Hospitals, Sub-divisional Hospitals and Referral Hospitals have also been declared as registration units. Recently, all the PHC have been notified as Registration Unit. • The work of Medical Certification of causes of Death is introduced in all the Medical college Hospitals and District Hospitals .
Registration of Birth & Death is still far from satisfactory due to - Overburdened Panchyat Secretary at the Panchyat level in over eight thousand Panchyats. - Shortage of Panchayat secretary. - Statistical functionaries not available for this work.. - Lack of basic infrastructure at the grass root level. - Lack of awareness among rural people. - Shortage of Panchayat secretary. - Lack of coordination between Panchayat registrars and notified informants.
Ad-hoc Survey / Census 1. Economic Census- Five 2. Minor Irrigation Census -Four 3. Goods Origin-Destination Survey conducted RITES. 4. Local Level Infrastructure Development survey CSO 5. Employment survey, Labour Bureau Simla.