Download
1 / 16
160 likes | 293 Vues
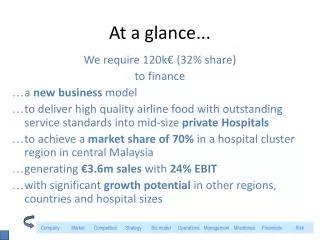
Explore Taiwan's booming economy with a 10.88% growth rate, high tech industries, and strategic role in Asia. Discover its lucrative trade relations and investment opportunities. Learn why an agreement with Taiwan can boost your business in the Asian market.

E N D
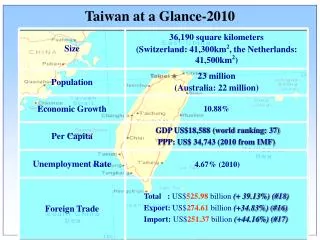
Size 36,190 square kilometers (Switzerland: 41,300km2, the Netherlands: 41,500km2) Population 23 million (Australia: 22 million) Economic Growth 10.88% Per Capita GDP US$18,588 (world ranking: 37) PPP: US$ 34,743 (2010 from IMF) Unemployment Rate 4.67% (2010) Total : US$525.98 billion (+ 39.13%) (#18) Export: US$274.61billion (+34.83%) (#16) Import: US$251.37 billion (+44.16%) (#17) Foreign Trade Taiwan at a Glance-2010
World’s Top 3 Taiwan Producers: IC Industry (9 items)、ICT Industry (10 items)、Photoelectric industry (6 items)、 Petrochemical Industry (7 items)、 Biotechnology Industry (2 items) 、 Automotive Industry (1 item) What is Taiwan famous for? • Mask ROMs (99.4%) • IC testing (70.5%) • Foundry (65.2%) • Optical discs (63%) • Chlorellas (50.5%) • IC packaging (45.7%) • Electro-deposited copper foils (37.3%) • Motherboards* (95.5%) • Notebook PCs* (95.3%) • Netbook PCs* (90.7%) • Cable CPEs* (78.6%) • LCD monitors* (71.8%) • Xdsl CPEs* (63%) • CRT monitors* (59.2%) • Desktop PCs* (38.9%) • PNDs (76.9%) • TFT-LCD panels (>10")(33.1%) • Glass fibers (30.3%) • OLED Panels (29.5%) • TFT-LCD panels (≦10")(23.8%) • IC design (23.2%) • Power wheelchairs & power scooters (23.2%) • IC substrates (20%) • TN/STN (19.2%) • ABS (19.1%) • LEDs (18.6%) • DRAMs (15.7%) • WLAN (5.5%) • PCBs (14.3%) • TPEs (13.9%) • PTAs (11.3%) • Nylon fibers (8.2%) • Polyester filaments (5.2%) • Beta-carotenes (4.0%) • PU leather (3.2%) 1st Place Worldwide 2nd Place Worldwide 3rd Place Worldwide For all these products, Taiwan ranked among the top 3 producers in the world (Taiwan’s Global Market Share % ) * Including offshore production
Bilateral Investment Leading Ex/Import Goods 文字 Bilateral trade Relationn 60,000 貿易 50,000 48631 47702 46944 總額 42656 40,000 40115 38751 37006 30358 出口 US million dollors 30,000 28058 27299 27008 金額 24811 22817 22479 21319 21332 20,000 19909 19937 19644 17845 17635 15934 15686 15335 15023 11693 10,000 進口 8216 金額 - 1,990 1,995 2,000 2,005 2,006 2,007 2,008 2,009 2,010 年 Bilateral Investment Bilateral Trade 文字 Per Capita Taiwan’s Ranking Taiwan investment in the EU The EU is the No. 1 foreign direct investor (FDI) in Taiwan,with an aggregate amount to €21.6 billion up to 2010. Taiwan investment in the EU is around €1.8 billion up to 2010. The EU investment in Taiwan
Accessing a Prosperous Market Why an ECA with Taiwan Matters: Expanding into the Asian Market Increasing ICT Competitiveness Eliminating Tariffs and NTBs Fulfilling the EU’s Asian Strategy
A Prosperous Market 23 million well-off consumers Growth: 10.88% (2010) (Average of 8% 1980-2010) 16th largest exporter and 17th largest importer (from WTO, 2011) High Market Potential Comprehensive networks into ASEAN and mainland China 2010 GDP per capita: $18,588 • Advantageous Business Environment • Low corporate income tax • Excellent talent and IPR Protection • Innovative R&D capabilities • 6 Industry clusters.
Bilateral Trade: US$ 70.8 billion (2010) Investment: Taiwan ASEAN: US$ 67.6 billion (2010) Vietnam’s 2nd largest FDI source, Thailand’s 3rd, Malaysia’s 5th, Cambodia’s 6th, Philippines’ 7th, Indonesia’s 8th. Taiwan’s Economic Relations with ASEAN Countries Taiwan’s engagement in Asia affords Europeans greater access to regional markets.
2hrs20mins 2hrs 82mins 2hrs50mins 2 hrs 3hrs45mins 4hrs30mins 4hrs35mins 5 hrs The Role of Taiwan in the Asia-Pacific Region Taiwan’s strategic geographical location
What Can Taiwan Offer? A Taiwan-Japan Investment Promotion and Protection Accord A Taiwan-EU Economic Cooperation Agreement ? • “The success rate of Japanese companies investing in mainland China has beenat 60%but will soar to 78%if they cooperate with Taiwanese businesses” -Kenichi Ohmae A Strategic Springboard With a tightly knit business network in mainland China and other Asian countries, Taiwan can serve as a gateway to mainland China and facilitate the EU’s commercial presence across Asia.
Elimination of Tariffs and NTBs • Economic Cooperation Agreement • With the elimination of tariffs and NTBs in Taiwan, benefits from EU • will increase: • GDP €2 billion per year • Exports € 11.8 billion within 2 - 5 years • Trade in goods: • electronics & machinery 1.7 billion • motor vehicles 1.6 billion • beverages and tobacco 0.9 billion • Trade in services: • engineering 2.0 billion • transport services 1.4 billion • trade services 0.9 billion • Non-tariff restrictions on services amounting to an overall tariff equivalent: • EU: 17.26% • Taiwan: 37.31% Source: Copenhagen Economics
EU’s FTA Strategy in Asia EU-Korea FTA EU-Japan FTA Taiwan EU-India FTA EU-Vietnam FTA EU-Singapore FTA EU-Malaysia FTA Taiwan-EU ECA Will Complete EU’s Asia Strategy Plus: ECFA Unprecedented Access to Greater China
Taiwan’s reach into Asia’s economic cooperation ECFA, IPR and 14 other agreements have been signed across the Strait. On September 22, 2011 Taiwan and Japan signed an Investment agreement. The Philippines has expressed interest in advancing an ECA with Taiwan. India has expressed interest in advancing an ECA. On October 25, 2011, Taiwan and New Zealand announced the start of a feasibility study. On December 15, 2010, negotiations between Taiwan and Singapore on an ASTEP were launched. Indonesia has expressed interest in advancing an ECA. with Taiwan.
Paving the way to a Taiwan-EU ECA Four technical working groups: IPR, NTBs, Pharmaceutical and SPS. More working groups can be established such as customs and investment. A report can be conducted by the Commission or an independent think-tank.
Time to re-evaluate the role Taiwan can play in EU’s trade policy in Asia. Towards a Future EU-Taiwan FTA EU-Taiwan ECA will create gains from regional (EU-China-Taiwan-ASEAN) trade and investment. EU-Taiwan ECA is in line with the Europe 2020 plan. Conclusions