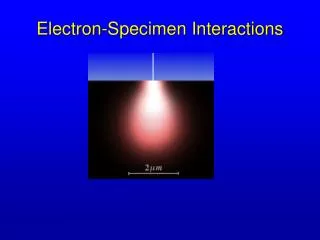
Electron-Specimen Interactions
Electron-Specimen Interactions. SEM Setup. Electron/Specimen Interactions. When the electron beam strikes a sample, both photon and electron signals are emitted. Incident Beam. Primary backscattered electrons. X-rays Through thickness composition info. Atomic number and topographical.

Electron-Specimen Interactions
E N D
Presentation Transcript
SEM Setup Electron/Specimen Interactions When the electron beam strikes a sample, both photon and electron signals are emitted. Incident Beam Primary backscattered electrons X-rays Through thickness composition info Atomic number and topographical Cathodoluminescence Electrical Secondary electrons Auger electrons Surface sensitive compositional Topographical Specimen Specimen Current Electrical
Primary Signals: Secondary Electrons Backscattered Electrons X-rays
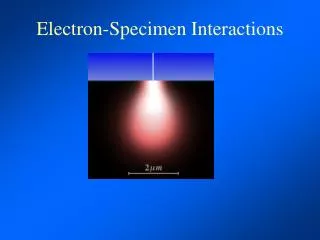
The size and shape of the region of primary excitation can be estimated by carrying out simulations that use Monte Carlo calculations and take into account the composition of the specimen
An interaction volume can also be used to predict the types of signals that will be produced and the depth from which they can escape. Monte Carlo simulations of electron trajectories are based on 1) the energy of the primary beam electron, 2) the likelihood of an interaction, 3) the change in direction and energy of the electron, 4) the mean free path of the electron and 5) a “random” factor for any given interaction.
Electron Flight Simulator http://www.small-world.net/efs.htm
Actual image of beam penetration into PMMA showing size and dimension of region of primary excitation
The angle at which the beam strikes the specimen and the distance from the surface are important factors in how much of signal escapes from the specimen.
Sometimes one can take advantage of the this effect and increase useable signal by tilting the specimen towards the detector and at an angle relative to the primary beam
The probability of an elastic vs. an inelastic collision is based primarily on the atomic weight of the specimen.
Secondary electron • < 50 eV • Backscatter electron >80% of primary electron energy X-ray 0.5 – 20 KeV
Auger Electrons Low energy electrons emitted from the upper 2-3nm of the surface and contains information about the element that produced it based on its energy
An Auger spectrum for Aluminum showing peaks for different electron replacement events
Secondary electrons are usually the result of an inelastic collision in which the transferred energy of the primary beam is transferred to an electron that is then emitted from the atom. Secondary electrons typically have an energy of 50 eV or less.
Although secondary electrons are produced throughout the interaction region they can only escape from the uppermost portion due their low energy
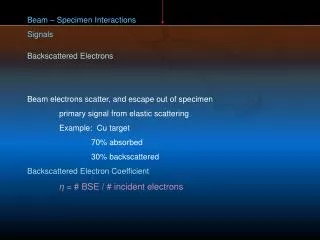
Backscattered electrons are the result of elastic collisions with atoms of the specimen. They result in emitted electrons that have an energy of 80% or more of the original energy of the primary beam electron
Backscattered electrons are also produced throughout the interaction region but because of their greater energy can escape from deeper in the specimen.
X-rays are indirectly produced when an electron is displaced through a collision with a primary beam electron and is replaced by another electron. The resultant loss of energy is given off in the form of an X-ray. The energy will always be less than the energy of the primary beam electron.
Because of their high energy X-rays can escape from very deep in the specimen.
Resolution in an SEM is ultimately determined by the size of the region from which signal is produced. Thus for the same region of excitation the resolution from the three signals differs and decreases from secondary to backscatter to X-rays.
Factors affecting size of the interaction region: Diameter of the primary beam Energy of the primary beam Atomic weight of the specimen Coating of specimen
Final primary beam probe size from a field emitter is 10-100X smaller than that of a conventional tungsten filament or LaB6 emitter. This is one reason why FESEMs have the best image resolution.
FESEMs also tend to remain stable at very low accelerating voltages (0.5 – 5 KeV) resulting in shallow regions of excitation and thus higher image resolution.
Effects of Accelerating Voltage Z = Atomic Weight E = Energy of primary beam
3.0 KeV 20.0 KeVEffects of Accelerating Voltage More signal (brighter)
3.0 KeV 20.0 KeVEffects of Accelerating Voltage But reduced resolution
Effects of Coating Sputtered Gold Chromium Mycoplasma pneumonia
The relationship of accelerating voltage (Eo) to atomic weight (Z) of the specimen and its affect on the depth of penetration can be summarized as above.
If the region of excitation remains small then signal will be produced from a small region and there will be no overlapping from adjacent regions. In this case each individual spot is resolved from its neighbors.
If the beam is scanned in exactly the same positions but the region of excitation is larger then the regions of signal production will also be larger and overlap with adjacent ones. Such an image would therefore not be resolved.
Even a slight increase in size of the region of signal production can result in decreased resolution.
Overlapping of signal production is also the primary reason why it is so critical to have the beam of an SEM properly stigmated. Even if the size of the region is kept small, it is only those regions which are perfectly circular that will produce the best resolution
Astigmatic regions may not reduce image resolution in one dimension.
But can still reduce resolution by overlapping with adjacent regions.
The position of the secondary electron detector also affects signal collection and shadow. An in-lens detector within the column is more efficient at collecting secondary electrons that are generated close to the final lens (i.e. short working distance).
Secondary Electron Detector Side Mounted In-Lens
A conventional secondary electron detector is positioned off to the side of the specimen. A faraday cage (kept at a positive bias) draws in the low energy secondary electrons. The electrons are then accelerated towards a scintillator which is kept at a very high bias in order to accelerate them into the phosphor.
The Everhart-Thornley detector has an aluminum coating (+10-12 KeV) that also serves to reflect the photons back down the light pipe.
The scintillator is a phosphor crystal that absorbs an electron and generates a photon
The photons produced in the scintillator are carried down a fiber optic light pipe out of the microscope.
Most of the secondary electron detector lies outside of the SEM chamber and is based on a photomultiplier tube (PMT)
A PMT works by converting the incoming photons into electrons which are then drawn to dynodes kept at a positive bias. The dynodes are made of material with a low work function and thus give up excess electrons for every electron that strikes them. The result “multiplies” the signal contained in each photon produced by the scintillator.
The electronic signal from the PMT is further increased by a signal amplifier. Thus an increase in “gain” is accomplished by voltage applied to the dynodes of the PMT and alters the contrast of the image. An increase in the “black” level is made by increasing the current in the amplifier and alters the brightness of the image. Signal is thus increased at the scintillator, PMT, and amplifier.
An in-lens detector does not use a faraday collector as this would affect the primary beam electrons but instead depends on the natural trajectory of the secondary electrons to strike it. It takes advantage of the focusing action of the lens to bring these electrons to cross over and then spread out to strike the annular detector.
Environmental electrons are a form of secondary electrons that are produced via interactions of secondary electrons produced by the specimen that strike gas molecules in the chamber, thus amplifying the signal.
Movie of melting sample in ESEM An environmental SEM or ESEM actually requires gas of some sort (usually water vapor) to create the signal and can operate at elevated pressures as high as 1 x 10 Torr