Download
1 / 21
210 likes | 332 Vues
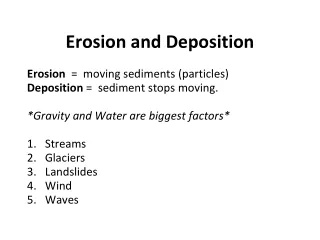
This study explores the erosion and deposition dynamics in tokamaks, focusing on tritium retention, material transport pathways, and remote areas for tritium control. Novel experimental techniques were crucial in identifying these mechanisms during fusion research. Enhanced carbon layer erosion due to ELM impacts is investigated, showcasing the influence of structural properties on erosion behavior.

E N D
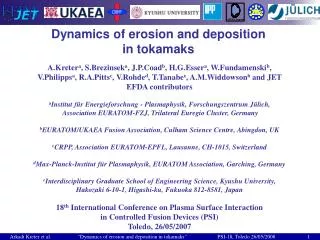
ASDEX Upgrade Dynamics of erosion and deposition in tokamaks A.Kretera, S.Brezinseka, J.P.Coadb, H.G.Essera, W.Fundamenskib, V.Philippsa, R.A.Pittsc, V.Rohded, T.Tanabee, A.M.Widdowsonb and JET EFDA contributorsaInstitut für Energieforschung - Plasmaphysik, Forschungszentrum Jülich, Association EURATOM-FZJ, Trilateral Euregio Cluster, GermanybEURATOM/UKAEA Fusion Association, Culham Science Centre, Abingdon, UKcCRPP, Association EURATOM-EPFL, Lausanne, CH-1015, Switzerland dMax-Planck-Institut für Plasmaphysik, EURATOM Association, Garching, Germany eInterdisciplinary Graduate School of Engineering Science, Kyushu University, Hakozaki 6-10-1, Higashi-ku, Fukuoka 812-8581, Japan 18th International Conference on Plasma Surface Interaction in Controlled Fusion Devices (PSI) Toledo, 26/05/2007
JET D-T experiment in 1997 Fusion energy record (22 MJ) pulse Best steady-state performance in type 1 ELMy H-mode M.Keilhacker et al, JNM 266-269 (1999) 1
JET D-T experiment in 1997 – Tritium retention B field configuration in 22 MJ pulse • T balance for DTE1 campaign • injected 35 g • retention after last • T-fuelled pulse 11.5 g • retention after cleanup 6 g MkIIA Vast majority of retained tritium found on louvre of inner divertor J.P.Coad et al, Phys Scripta T81 (1999) 7 inner louvre Modelling needed ~10 times higher erosion yield to reproduce deposition on inner louvre A.Kirschner et al, PPCF 45 (2003) 309 Turning point in reactor relevant PSI research Novel experimental techniques and tools were necessary to identify the mechanisms of dynamics of erosion and deposition
Remote areas and tritium retention W CFC JET MkIIA divertor ITER divertor test module inner louvre outer louvre Remote (shadowed) areas areas without direct plasma contact Reservoir for deposited material and tritium T-removal techniques inefficient Critical for T retention control Gaps of castellated structures are remote areas specific for ITER Potentially huge reservoir for retention K.Krieger et al, JNM 363-365 (2007) 870
Major pathways of material transport in tokamaks Poloidal cross-section of a divertor tokamak • Consistent experience of C-tokamaks (AUG, DIII-D, JET, JT-60U etc.) • Main chamber wall is the main source of eroded material • SOL flow drives material towards divertor legs • Deposition in divertor as amorphous C layers • Asymmetry in SOL flow determines in-out asymmetry of deposition in divertor Normal B field direction (ion BB drift towards X-point) • SOL flow mainly towards inner divertor • Deposition mainly in inner divertor JET reversed B field campaign: Reversed SOL flow Deposition in outer divertor R.A.Pitts et al., JNM 337-339 (2005) 146. P.Andrew et al., JNM 337-339 (2005) 99. SOL flow Core plasma BB Vessel walls Separatrix PFR deposition deposition Divertor targets
SOL flow - 13C injection experiments 13CH4 tracer injection to study carbon migration for certain discharge type Performed in AUG, DIII-D, JET, JT-60U etc. 13C 13C DIII-D and JET: 13C travels from top of the vessel mainly towards inner divertor, in agreement with campaign integrated observations JET S.L. Allen et al, JNM 337–339 (2005) 30. J.Likonen et al, Fus. Eng. Design 66-68 (2003) 219 Ohmic L-mode OSP ISP ISP OSP
SOL flow - 13C vs. long-term deposition in ASDEX Upgrade ASDEX Upgrade ) z(m 13C and long-term 12C deposition in divertor of AUG Geometry of 13C injection in AUG #18200 inner outer 1.0 12C long-term 0.5 13C 0.0 13C puffing -0.5 0 1.6 • 13C evenly distributed between inner and outer divertor • Long-term 12C mainly in inner divertor • Stagnation point of SOL flow close to outer midplane • Most carbon from main chamber is driven towards inner divertor -1.0 s-coordinate 1.0 1.5 2.0 2.5 R(m) 13CH4 puffed from outer midplane in 13 identical H-mode discharges E. Vainonen-Ahlgren et al., JNM 337-339 (2005) 55.
Quartz Microbalance (QMB) in-situ deposition monitors • Techniques to measure erosion and deposition • Post-mortem: campaign integrated footprint, averaged over many conditions • 13C tracer injection: single condition, but limited number of experiments • QMB monitors: instant data for variety of discharge conditions Photograph of QMB in JET QMBs in JET divertor • Detection limit • 11015 C atoms/cm2 1 monolayer of a-C:H • Higher deposition on QMB higher erosion of target • Time resolution by shutter • Solid discharge database evolved aperture to detector (~ 1 cm2) shutter
Most of following results are based on recent QMB measurements during JET campaign 2005-2007 The evidence will be shown for • Enhanced erosion of carbon layers due to ELM impact • Line-of-sight carbon transport • Erosion depends on structural properties of carbon
ELM-induced enhanced erosion in JET – An example Experiment on impact of large ELMs in JET (see talk by R.A.Pitts (O-8) for details) ELMs up to 800 kJ Inner strike point at tile 3 Usually low deposition on inner QMB # 70225 (no fuelling huge but rare ELMs) # 70222 (fuelling 1.2·1022 e/s) QMB exposure time window QMB exposure time window D (inner) D (inner) Wdia [MJ] Wdia [MJ] large ELMs within QMB exposure strong net-deposition on QMB 4·1015 C/cm2 (~0.8 nm) no large ELMs within QMB exposure zero net-deposition on QMB Erosion of inner target largely defined by ELMs
ELM-induced enhanced erosion in JET –only inner target affected B field configuration for database • Pulse selection criteria: • Stable discharge conditions • Symmetric B field configuration • with line-of-sight to QMBs Deposition rate vs. energy of largest ELMs Outer divertor: no ELM influence Inner divertor: deposition increases with ELM size ELM effect attributed to permanent thick re-deposited layers in inner divertor Influence of different ELMs in each datapoint – can it be resolved ? deposition C deposition rate [atoms/cm2s] erosion WELM (averaged over largest ELMs) [kJ]
ELM-induced enhanced erosion in JET – Strong non-linear impact Inner louvre: Deposition per ELM vs. ELM energy Processed exp. data 16 10 15 10 ~10x less C deposition per ELM [atoms/cm2] Arrhenius-type equation: 14 10 Carbon deposition on QMB reflects erosion of divertor target, mainly from ISP position Physical sputtering (Y=1.5%) 13 10 0 100 200 300 400 500 ELM energy WELM [kJ] Thermal decomposition of carbon layers under ELM impact
Effect of geometry (SP position) in JET -line-of-sight transport in inner divertor Deposition in inner louvre vs inner strike point position JET MkII-HD divertor C deposition [atoms/cm2s] s-coordinate along contour of divertor tiles 3 4 1 Inner strike point s-coordinate [m] Highest deposition when inner SP at tile 4 Transport to inner louvre mainly line-of-sight from inner SP position
Line-of-sight carbon transport in ASDEX Upgrade ASDEX Upgrade Divertor geometry in AUG QMB measurements for different outer SP positions QMBs with different orientations Higher deposition on QMB when line-of-sight to SP position (case B), attributed to erosion and transport of hydrocarbons with high sticking (Note: there were re-deposited carbon layers at this location in AUG) V. Rohde et al., Phys. Scripta T111 (2004) 49.
Effect of geometry (SP position) in JET -higher C flux to PFR from vertical target QMB under tile 5 (LBSRP) integral behaviour for commissioning phase 2005 6000 ISP at horizontal tile ISP at vertical tile ISP at hori-zontal tile ISP at vertical tile ISP at hori-zontal tile 5000 4000 3000 Integral deposition at QMB [Hz] 2000 1000 integral deposition integral erosion integral deposition integral erosion integral erosion 0 64800 65000 65200 65400 65600 65800 1 Hz 0.8 Å deposition for a-C:H of 1 g/cm3 JET pulse # Higher carbon flux to Private Flux Region when inner SP at vertical target For details see poster by H.G. Esser (P2-19)
Effect of geometry (SP position) in JET -Outer divertor transport not line-of-sight Deposition in outer louvre vs outer strike point position WELM > 100 kJ deposition C deposition [atoms/cm2s] erosion 7 6 5 Outer strike point s-coordinate [m] Integral deposition in outer divertor louvre is ~1/3 of inner No trend to line-of-sight transport Attributed to lower deposition / different structure of layers at outer target
Effect of geometry (SP position) in JET -Cross-talk between divertor legs Deposition in outer louvre vs inner strike point position deposition C deposition [atoms/cm2s] erosion 3 1 4 Inner strike point s-coordinate [m] Trend to net-erosion when inner strike point at horizontal tile 4 Trend to net-deposition when inner strike point at vertical tiles 1 and 3 Reminder: carbon flux to PFR higher if inner strike point at vertical target Implies inner target as source of carbon for outer divertor Additional source of carbon can change balance from net-erosion to net-deposition
Shot history effect in JET – Erosion depends on carbon structure Deposition in inner louvre shot-by-shot (H-mode with WELM > 100kJ) Geometry of B field in divertor HT HT conditioning C deposition [atoms/cm2s] conditioning VT HT HT HT VT VT VT JET pulse running order • Higher erosion of freshly deposited carbon layers with respect to conditioned layers (up to 4 times), conditioning within ~10 s of H-mode with large ELMs, longer for L-mode • Higher erosion of fresh layers observed in NSTX (C.H. Skinner et al., JNM 363–365 (2007) 247.) • Erosion rate depends on carbon material properties: • Bare CFC – low erosion • Conditioned permanent layers – higher erosion (incl ELM effect) • Freshly deposited hydrogen rich (soft) layers – even higher erosion
Strike Point sweeps in JET –Cause of high inner target erosion Strike point sweeps (scan of strike point position) Example of SP sweep in JET • SP sweeps are discussed option for • Increase of target lifetime • Target conditioning (T removal) SP sweeps lead to manifold (up to ~10) increase of deposition in inner louvre Bad option with respect to fuel retention in remote areas (cf. "clean-up" campaign after JET DT experiment 1997)
Disruptions in JET – Cause of strong additional deposition in remote areas QMB disruption "database" 6 pulses – inner louvre QMB, 3 pulses – outer louvre QMB (all unmitigated, "normal" type disruptions – no ITB, VDE) Heavy deposition during disruptions in both inner and outer louvre Deposition independent of B field configuration (SP positions), unlike for "normal" operation Strong broadening of energy deposition pattern during disruptions Deposition increases with released energy Thermal nature of target erosion process Inner louvre deposition vs. Wdia at thermal quench Outer louvre deposition vs. Wdia at thermal quench C deposition [atoms/cm2] C deposition [atoms/cm2] Wdia [MJ] Wdia [MJ] If every discharge in JET is terminated by mid-sized disruption, campaign integrated deposition in louvres would be 3 times higher ! Effect of mitigated disruption will be studied in ongoing JET campaign
Conclusions • Major players determining material redistribution/ deposition in remote areas • Magnetic field configuration (SP position) • Line-of-sight transport • Structural property of eroded carbon material • Highest erosion of freshly deposited "soft" layers • ELM-induced enhanced erosion • Dramatically (~10x) increases erosion of hydrogenated carbon layers • Acts for hydrogenated carbon layers, not for bare CFC • Does not drastically increase total amount of eroded carbon/overall retention in vessel (see talk by T.Loarer R-3) • But increases long-term retention through re-distribution of carbon towards remote areas • Pronounced for WELM > 100 kJ , will increase deposition in remote areas of ITER (with carbon) • All these features explain the heavy T retention in inner louvre during DT experiment in 1997