Attendance Improvement
Attendance Improvement. “A Do It Together” Toolkit for Community Schools . Spring 2014. Illustrating the Gap Exercise. http://www.attendanceworks.org/wordpress/wp-content/uploads/2010/06/parentexercise_GAPS.pdf. Make the Case – Community Schools Attendance Imperative Video. Reflection.

Attendance Improvement
E N D
Presentation Transcript
Attendance Improvement “A Do It Together” Toolkit for Community Schools Spring 2014
Illustrating the Gap Exercise http://www.attendanceworks.org/wordpress/wp-content/uploads/2010/06/parentexercise_GAPS.pdf
Make the Case – Community Schools Attendance Imperative Video.
Reflection Pair Share: How might you use these tools in your work?
Need more ? Get Our Power Point http://www.attendanceworks.org/tools/for-attendance-presentations/ The following slides are examples of what the powerpoint includes.
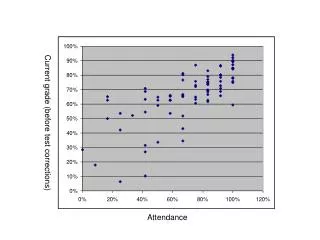
Average Daily Attendance Can Mask Chronic Absence 90% and even 95% ≠ A 98% ADA = little chronic absence 95% ADA = don’t know 93% ADA = significant chronic absence
Chronic Absence:A Hidden National Crisis • Nationwide, as many as 10-15% of students (7.5 million) miss nearly a month of school every year. That’s 135 million days of lost time in the classroom. • In some cities, as many as one in four students are missing that much school. • Chronic absenteeism is a red alert that students are headed for academic trouble and eventually for dropping out of high school. • Poor attendance isn’t just a problem in high school. It can start as early as kindergarten and pre-kindergarten.
Starting in PreK, More Years of Chronic Absence = Need for Intensive Reading Support By 2nd Grade Some risk At risk * Indicates that scores are significantly different from scores of students who are never chronically absent, at p<.05 level; **p<.01; ***p<.001
Students Chronically Absent in Kindergarten and1st Grade are Much Less Likely to Read Proficientlyin 3rd Grade Source: Applied Survey Research & Attendance Works (April 2011)
The Long-Term Impact of Chronic Kindergarten Absence is Most Troubling for Poor Children 5th Grade Math and Reading performance by K attendance for children living In poverty. Academic performance was lower even if attendance had improved in 3rd grade. Source: ECLS-K data analyzed by National Center for Children in Poverty (NCCP) Note: Average academic performance reflects results of direct cognitive assessments conducted for ECLS-K.
Multiple Years of Elementary Chronic Absence = Worse Middle School Outcomes Each year of chronic absence in elementary school is associated with a substantially higher probability of chronic absence in 6th grade 18.0x • Chronic absence in 1st grade is also associated with: • Lower 6th grade test scores • Higher levels of suspension Increase in probability of 6th grade chronic absence 7.8x 5.9x Years of Chronic Absence in Grades 1-5 Oakland Unified School District SY 2006-2012, Analysis By Attendance Works
The Effects of Chronic Absence on Dropout Rates Are Cumulative With every year of chronic absenteeism, a higher percentage of students dropped out of school. http://www.utahdataalliance.org/downloads/ChronicAbsenteeismResearchBrief.pdf
Find Out Why Students Are Chronically Absent Chronic disease
Site-Level Strategies for Building a Culture of Attendance & Identifying Barriers
Increased Attendance Involves a 3-Tiered Approach that Fits with Most Reform Efforts Students who were chronically absent in prior year or starting to miss 20% or more of school A small fraction of a school’s students High Cost Recovery Programs Some of a school’s students Students at risk for chronic absence Universal/Preventive Programs Intervention Programs All students in the school All of a school’s students Low Cost
Ingredients for System-wide Success & Sustainability District Community Conveys why building a habit of attendance is important and what chronic absence is Is accurate, accessible, and regularly reported Positive Messaging Actionable Data Schools Students & Families Shared Accountability Capacity Building Ensures monitoring & incentives to address chronic absence Expands ability to interpret data and work together to adopt best practices Strategic partnerships between district and community partners address specific attendance barriers and mobilize support for all ingredients
Data Check In How many of you have data on chronic absence in your community? How many of you know who you could go to ensure chronic absence rates are calculated?
Encourage District to Calculate Chronic Absence? FREE FROM ATTENDANCE WORKS! The District Attendance Tracking Tools (DATT) and School Attendance Tracking Tools (SATT) are now available in Three Modules! • Grades K-5 • Grades 6-8 • Grades 9-12 We also offer a Tool to Combine the Modules forK-12 reports.
Use data to determine the size and scope of the issue District A has a 19% chronic absence rate. In contrast, District B has a problem half the size with a 10% Chronic absence rate.
Use data to identify where interventions are needed most Example from K-12 Combination Tool
Use chronic absence data to find positive outliers & schools needing support Chronic Absence Levels Among Oakland Public Schools (2009-10)
Use chronic absence data to identify students in need of support. All three DATTs are designed so a simple cut-and-paste of student data into the School Attendance Tracking Tool generates Student Lists that can be sorted by level of absence.
Welcome to New York! Welcome to New York! Every Student, Every Day Initiative 2010-2013
The Response: Interagency Task Force • Established in 2010 by Mayor Bloomberg and comprised of the Mayor’s Office, Department of Education, and various other city agencies • Key Aspects: • Using Data to Measure, Monitor, and Act • Success Mentors • Principal Leadership • New Models for Connecting Community Resources to Schools • Promoting Awareness • Incentives, Recognition, and Response • Accountability Strategies to Sustain Efforts MAYOR’S INTERAGENCY TASK FORCE 25
Success Mentor Models • Three Models: Developed with Nationally Recognized Leaders • External: Community-based Organizations • E.g. City Year, Social Work Students, Retired Professionals • Internal: School Staff • E.g. Teachers, Guidance Counselors, Social Workers, Classroom Teachers, Administrators • Peer-to-Peer: Students • E.g. High school seniors/juniors mentoring freshman MAYOR’S INTERAGENCY TASK FORCE 26
Success Mentors’ Responsibilities • Target Students • Success mentor assigned “target” students who were chronically absent the year prior, and is matched with these students early in year, for full year. • School-Wide Strategies • Promote a positive school-wide culture that encourages all students to attend and achieve. • Principal’s Weekly Student Success Meeting • Attend the weekly meeting and collaborate with school partners to support mentees. • Parental Engagement • Work with families to share importance of attendance, and call home for every absence. • Interact with parents to celebrate students’ success whether big or small. MAYOR’S INTERAGENCY TASK FORCE 27
Key Finding: Task Force Schools Significantly Reduced Chronic Absenteeism • All three cohorts of task force schools consistently outperformed comparison schools. • Positive impacts were consistent across elementary, middle, high schools, and alternative schools. • Impacts greatest for students who benefit most from being in school: high poverty students & students in temporary housing. MAYOR’S INTERAGENCY TASK FORCE 28
Key Finding: Success Mentors & Supporting Infrastructure Substantially Improved Student Attendance • Students with prior histories of chronic absenteeism with a Success Mentor gained nearly two additional weeks of school (9 days), which is educationally significant. • In the top 25% of schools, students with Success Mentors gained one additional month of school. • High School students with Success Mentors (including those overage for their grade) were 52% more likely to remain in school the following year. • Mentees reported they liked having a mentor and the mentor helped improve their attendance, schoolwork, motivation, and confidence. MAYOR’S INTERAGENCY TASK FORCE 29
Provide Technical Assistance to Support the Work • Conducted feedback sessions with students on what they want and need (e.g. surveys, roundtables, summits). • Conducted school site visits and attended Weekly Student Success Meetings to help maximize its impact. • Supported schools implementing Success Mentors programs (external, internal, peer-to-peer). • Used data to drive high-impact. • To ensure sustainability, provided schools with ongoing technical assistance from a community-based organization.
Tools and Resources • Starting Strong Action Planning Tool • Setting up a Mentoring Program for Target Students • Implementing School-wide/Universal Strategies • Identifying Strategic Partnerships • How To Guides • Creating a Target List • Effective Weekly Attendance Meetings • How To Run a Parent Summit • Success Mentor and Principal Guides • Detailed guides on roles and responsibilities
To Learn More…. NYC.GOV/EVERYSTUDENT or contact Sarah Jonas Director of Regional Initiatives sarahj@childrensaidsociety.org
Join us in September forAttendance Awareness Month http://www.attendanceworks.org/attendancemonth/
Key Components Strategic shared messaging campaign that includes designation of September as Attendance Awareness Month Promoting community level action and engagement, especially in conjunction with Attendance Awareness Month Using public events during September to garner media attention and raise public awareness
Post Your Involvement On the Map Communities can pin on the map to show involvement and connect with others New: Districts will be able to post if they are monitoring data http://www.attendanceworks.org/attendancemonth/
Free Attendance Awareness Month Webinars April 8Count Us In (Again!) – kickoff event of AAM 2014 – launching AAM 2014 with release of Count Us In 2.0 and stories from communities that participated in AAM 2013 May 28 We Need You: Enlisting Allies for Attendance Awareness Month – featuring educators, health providers and other potential partners August 6 Engaging Parents and Youth – new resources for messaging about attendance to parents and youth http://www.attendanceworks.org/peer-learning-resources/
Final reflection What is one action you will take when you return home as a result of participating in this workshop?