Download
1 / 33
330 likes | 480 Vues
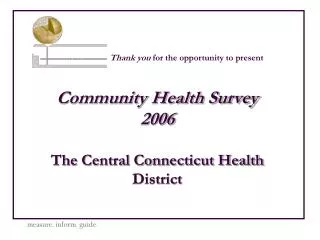
Central Connecticut Health District. Community Health Report Card October 2008. Population. Source: CT Department of Public Health, US Census 2000, Connecticut Economic Resource Center, Inc., www.cerc.com. % Below Poverty Level. Source: 2000 Data Obtained from U.S. Census Bureau. Race (%).

E N D
Central Connecticut Health District Community Health Report Card October 2008
Population Source: CT Department of Public Health, US Census 2000,Connecticut Economic Resource Center, Inc., www.cerc.com
% Below Poverty Level Source: 2000 Data Obtained from U.S. Census Bureau
Race (%) Source: 2007 Estimates obtained from Connecticut Economic Resource Center www.cerc.com
Households Source: 2000 Data Obtained from U.S. Census Bureau
Top 5 Leading Causes of Death *Chronic Lower Respiratory Disease (CLRD); Year 2006 Source: Connecticut State Department of Public Health
% Low Birth Weight* * Weight less than 2,500 grams Source: Connecticut State Department of Public Health, Registration Reports1998-2006
Births: % Very Low Birth Weight* Weight Less Than 1,500 grams (a) Not reported,< 5 events per town Source: Connecticut State Department of Public Health, Registration Reports 1998-2006
% Non-adequate Prenatal Care Source: Connecticut State Department of Public Health, Registration Reports 1998-2006
Infant Deaths (rate) Rate is per 1,000 live births; not calculated if < 5 Source: Connecticut State Department of Public Health, Registration Reports 2000-2006
% Births to Teens < 20 years (a) Not calculated for < 5 events Source: Connecticut State Department of Public Health, Registration Reports 1998-2006
Lead Screening% Children <6 Years Screened Each Year Source: Connecticut State Department of Public Health
Lead PoisoningTests (%) > 20g/dl (children <6 years) Source: Connecticut State Department of Public Health
Sexually Transmitted Diseases(Gonorrhea, Chlamydia, Syphilis) Majority of cases are Chlamydia Source: Connecticut State Department of Public Health
AIDS Cases Source: Connecticut State Department of Public Health HIV/AIDS Surveillance
Total Living with HIV/AIDS 1980-6/30/08 Source: Connecticut State Department of Public Health HIV/AIDS Surveillance
Active Tuberculosis Source: Connecticut State Department of Public Health
Hepatitis A Source: Connecticut State Department of Public Health
Acute Hepatitis B Source: Connecticut State Department of Public Health
Hepatitis BChronic Carrier Source: Connecticut State Department of Public Health
Hepatitis CChronic / Resolved Source: Connecticut State Department of Public Health
Foodborne Related Illness*# Cases (Rate/10,000) *Salmonellosis, Shigellosis, Campylobacteriosis, Cyclosporiasis, Listeriosis, Cryptosporidiosis, E.Coli 0157, Vibrio, Yersiniosis Source: Connecticut State Department of Public Health
Lyme Disease# Cases (Rate/100,000) Source: Connecticut State Department of Public Health
Asthma ER VisitsChildren < 18 years frequency (rate/10,000) Source: Connecticut State Department of Public Health (a) Rate no longer calculated when < 6 cases per town
Asthma ER VisitsAdults 18+ frequency (rate/10,000) Source: Connecticut State Department of Public Health
Asthma HospitalizationsChildren <18 years frequency (rate/10,000) (a) No longer reported when < 6 cases per town Source: Connecticut State Department of Public Health
Asthma HospitalizationsAdults 18+ frequency (rate/10,000) (a) Rate no longer calculated when < 6 cases per town Source: Connecticut State Department of Public Health
Asthmatics Grades Pre-K & KindergartenGrades 6,7,10 &11 Source: Regional Asthma Coalition – Rank based on number of cases School district with Rank 1 has highest # of students with asthma; 35 school districts in Region II