Download
1 / 23
230 likes | 422 Vues
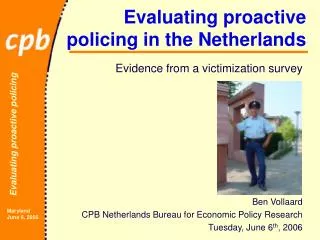
Evaluating proactive policing in the Netherlands. Evidence from a victimization survey Ben Vollaard CPB Netherlands Bureau for Economic Policy Research Tuesday, June 6 th , 2006. 1993-2002: Doing less with more means. Police personnel per capita. Satisfaction about police response

E N D
Evaluating proactivepolicing in the Netherlands Evidence from a victimization survey Ben Vollaard CPB Netherlands Bureau for Economic Policy Research Tuesday, June 6th, 2006
1993-2002:Doing less with more means Police personnel per capita Satisfaction about police response to neighborhood problems Criminal cases per capita Sources: PMB, OM, CBS, MinBZK
Research question • Has the push for proactive policing contributed to a decline in crime, disorder and fear of crime during the period 2003-2005?
Outline • Dutch Victimization Survey • Research design • Estimation results • Conclusions
Dutch Victimization Survey:a unique source of data • Hard to get good data on style of policing • Police statistics incomplete, unreliable or simply not available • Observations of researchers for only one or a few locations • Survey includes questions about style of policing of local police department, provides data for 472 municipalities during 1993-2005
Hot spots policing City of The Hague, 1993-2005 ‘See police too little’ (%) Actual visibility equal lower dissatisfaction with police visibility ‘See police at least once a week’ (%)
How reliable are citizens’ observations of police work? • Dissatisfaction with police fining related to actual police fines (at the municipality level) • Citizens’ picture of well/poorly performing police forces confirmed by other sources • Citizens’ response not simply based on local safety situation (‘it is safe, the police must be doing a good job’ and vice versa): • Dissatisfaction was growing during crime drop • Degree of urbanization (as proxy of crime) not related to citizen satisfaction
Δ Local style of policing • Relate variation in changes in local style of policing to individual data on victimization • Control for overall visible police resources • Heterogeneity: • Individual background characteristics (employment, age, education, ethnicity, housing type, household size) • Dissatisfaction with style of policing • Municipality fixed effects • Simultaneity • 1993-2001: neither resources nor policing styles responsive to changes in local safety situation • 5 waves (1993, 1995, 1997, 1999, 2001), 370,000 respondents; 472 municipalities
What do we estimate? P(Crimeijt) = α Hot spotsjt+β Disorderjt + γ Visibilityjt + Xijtδ + ηj + μt + εijt Victimization {0,1} ‘Too little visible’? {0...1} ‘Too little aggressive’? {0...1} See police weekly? {0...1} Individual background characteristics {0,1} Municipality fixed effects {0,1} Year fixed effects {0,1}
Robustness • Simultaneity: • Including host of municipality characteristics does not affect estimated effects (employment, ethnicity, demography, etc.) for 1993-2001 • 2003-2005: greater responsiveness of style of policing to local trends in crime and disorder • Alternative source of data: • Actual police fines produces similar results for aggressive driving, somewhat higher estimates for disorder and property crime
(1) Push for proactive policing enhanced police effectiveness • Performance contracts and accompanying local initiatives affected style of policing and contributed to decline in crime and disorder: • disorder – 3 to – 8 % • fear of crime – 2 to – 4 % • property crime – 1 to – 7 % • violent crime – 3 % to – 4 %
(2) Strengthening incentives cost-effective way of improving safety • Performance only improved with outside intervention • Similar drop in crime also possible with more police personnel • Would cost some 5600 FTEs additional police personnel = € 380 million annually (Vollaard en Koning, 2005) • More cost-effective to put existing resources to better use by strengthening incentives
(3) Citizen satisfaction meaningful indicator of police performance • Other sources confirm picture based on citizens’ observations • Important determinants of police effectiveness • Could be used to hold the police accountable to results (benchmarking)