Download
1 / 20
200 likes | 240 Vues
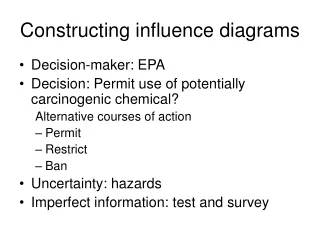
Learn how influence diagrams offer a graphical way to structure decision problems, considering decisions, uncertain events, and outcomes. Explore the use of nodes like Chance, Deterministic, Decision, and Value nodes, and see examples of representing influence through arcs. Discover strategies, common mistakes to avoid, and handling deterministic nodes for more extensive decision analyses.

E N D
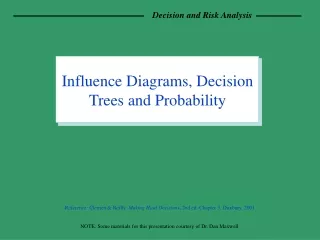
Influence Diagrams, Decision Trees and Probability Reference: Clemen & Reilly. Making Hard Decisions, 2nd ed. Chapter 3. Duxbury, 2001 NOTE: Some materials for this presentation courtesy of Dr. Dan Maxwell
Influence Diagrams • Another way to structure decision problems • Graphical representation • Considers: • Decisions to make • Uncertain events • Value of outcomes } Nodes in network Chance Node Deterministic Node Decision Node Value Node – Relations between nodes
Influence Diagrams Chance Relevance Value Decision Probabilistic Relevance Information Arc Deterministic Chance Functional Relevance
Representing Influence with Arrows F A B E The outcome of event A is relevant for assessing the chances associated with event B. The decision maker has information on the outcome of event E when making decision F. C D G H Decision C is relevant for assessing the chances associated with event D. Information from Decision G is used to make decision H.
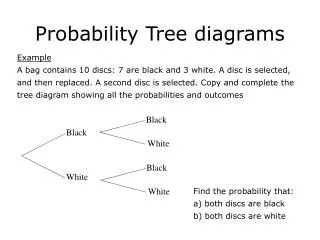
Basic Risky Decision Outcomes: Market Up Market Down Market Activity Investment choice Payoff Market ChoiceOutcomePayoff Choices: Stocks Savings 200 200 500 -400 Up Down Up Down Savings Stocks
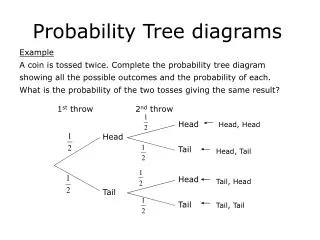
Evacuation Decision Possible Forecasts Will Hit Miami Won’t Hit Miami Outcomes: Hits Miami Misses Miami Hurricane Path Forecast Evacuation Decision Payoff ChoiceOutcomePayoff Choices: Evacuate Stay Safety High Cost Danger Low cost Safety Low Cost Hit Miss Hit Miss } Evacuate Stay Note: Decision made after forecast – Forecast is imperfect – Is forecast correct?
Strategy for Building Influence Diagrams • • No Recipe • • Start with very simple diagram • – Iteratively add detail • – Stop when enough to capture essence of problem • – There is art involved • • Common Mistakes • – Interpret as flowchart • - No sequential nature • - No cycles • – Influence not causation
Deterministic Nodes • • Additional nodes to aggregate intermediate results • • Emphasizes and simplifies structure of the ID ex. New Product Introduction (1) • Very simple representation • Value is the profit – derived from revenue and cost • Might not capture all relevant aspects of problem Revenue Cost Introduce Product Profit
Deterministic Nodes ex. New Product Introduction Units Sold (2) Fixed Cost Variable Cost Price Profit Introduce Product • More complex – captures more detail • Harder to understand and evaluate
Deterministic Nodes ex. New Product Introduction Units Sold (3) Fixed Cost Variable Cost Price Introduce Product Cost Revenue • Uses Deterministic Nodes • Sometimes denoted with double circle or as value node • Easier to understand and evaluate Profit
Deterministic Nodes ex. New Product Introduction Units Sold (3) Fixed Cost Variable Cost Price Introduce Product Cost Revenue • Uses Deterministic Nodes • Sometimes denoted with double circle or as value node • Easier to understand and evaluate Profit
Multiple Objectives • • Value of outcome depends on tradeoffs of competing objectives • • Can be represented in Influence Diagrams as follows: ex. FAA decision on Bomb Detection System Bomb Detection System Choice Detection Effectiveness Time to Implement Passenger Acceptance Cost • Build Additive Value Function Overall Satisfaction
Multiple Objectives • • Value of outcome depends on tradeoffs of competing objectives • • Can be represented in Influence Diagrams as follows: ex. FAA decision on Bomb Detection System Bomb Detection System Choice Detection Effectiveness Time to Implement Passenger Acceptance Cost Overall Satisfaction Measure
Multiple Objectives • • Value of outcome depends on tradeoffs of competing objectives • • Can be represented in Influence Diagrams as follows: ex. FAA decision on Bomb Detection System Bomb Detection System Choice Detection Effectiveness Time to Implement Passenger Acceptance Values Cost Overall Satisfaction Measure
Sequential Decisions • • Simplest is 2 decision sequence • • No cycles allowed in Influence Diagrams • • Sequential decisions are “strung together” ex. Orchard owner decision to protect trees from bad weather Weather Day 1 Weather Day 2 Weather Day n Forecast Day 1 Forecast Day 2 Forecast Day n Protect? Day 1 Protect? Day 2 Protect? Day n Payoff Day 1 Payoff Day n Payoff Day 1 Total Payoff
Sequential Decisions • • Simplest is 2 decision sequence • • No cycles allowed in Influence Diagrams • • Sequential decisions are “strung together” ex. Orchard owner decision to protect trees from bad weather Weather Day 1 Weather Day 2 Weather Day n Forecast Day 1 Forecast Day 2 Forecast Day n Protect? Day 1 Protect? Day 2 Protect? Day n Payoff Day 1 Payoff Day n Payoff Day 1 Total Payoff
Strategy for Building Influence Diagrams • • No Recipe • • Start with very simple diagram • – Iteratively add detail • – Stop when enough to capture essence of problem • – There is art involved • • Common Mistakes • – Interpret as flowchart • - No sequential nature • - No cycles • – Influence not causation
Solving Influence Diagrams • Step 1: Clean up Influence Diagram • No “Barren Nodes” • Only one Value Node (or one Super Value Node into which all the other value node feed) • No cycles • Step 2: Look for any Chance Nodes that: • Directly precedes the Value Node (only node) • Do not directly precede any other type node • Reduce these nodes by taking expected values • Value node inherits their predecessors
Algorithm (continued) • Step 3: Look for Decision node that: • Directly precedes the Value Node, and • Has as predecessors all other direct predecessors of the Value Node • If none, go to Step 5. • Else, reduce the node by choosing the optimum [expected] value. • Step 4: Go to Step 2 and continue until the Influence Diagram is completely solved • Step 5: You are here because you couldn’t reduce any chance nodes. • Reverse the arc between 2 chance nodes using Bayes Theorem and go to Step 2.
Solving Influence Diagrams • Influence Diagrams are usually solved using software • Freeware and Commercial software exists • In this class, we will use the Decision Tools software provided with the text • WARNING! Register software < 30 days • For exam, I won’t ask you to solve directly from a influence diagram