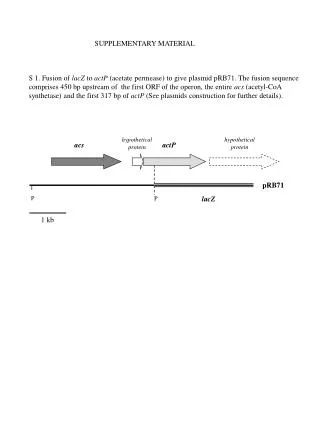
Download
1 / 18
180 likes | 255 Vues
Explore the intricate realm of organic aerosols’ infrared optical properties to unlock their impact on climate change and remote sensing. Dive into laboratory techniques, air flow cell systems, and spectral analysis.

E N D
ACS-II-2004 Philadelphia, PA 22-26 Aug 04
Introduction Atmospheric aerosols, particularly those found in the troposphere, are thought to have a profound effect on several fronts ranging from human health to global climate change. The extent of this impact is not well known due to insufficient knowledge about the chemical, physical, and optical properties of the materials that make up these particles. This is especially true for aerosols that contain organic materials1 despite the fact that they comprise a large fraction of the fine particulate matter in urban areas.2 Understanding the interaction between photons and organic aerosols is of primary concern to those involved in remote sensing applications and climate modeling. Particles can directly interact with light and thus give rise to absorption and scattering.3 They can also indirectly affect such interactions by influencing cloud formation4 or participating in chemical reactions that lead to the formation of hazes and smogs.5 Our laboratory focuses on quantifying the infrared optical properties of organic materials by determining their complex refractive indices, or optical constants as they are sometimes referred to. The complex refractive index, N, at frequency is given by: where n and k are respectively the real and imaginary components of the refractive index; the former governs the scattering of light while the latter determines the extent of photon absorption. The components cannot be measured directly and instead must be inverted from other laboratory observations.
The lack of available optical properties for organic compounds is exemplified by the results of a recent search which yielded infrared optical constant data sets for benzene6, chlorobenzene7, chloroform8, toluene9, methanol10, dichloromethane11, some byproducts of vegetation burning12, several terpenes and PAHs (polycyclic aro-matic hydrocarbons)13, and dihydroxy-acetone14. We recently added to this list by reporting infrared complex refractive indices for carvone, a bio-synthesized monoterpene that is found in the essential oils of spearmint and caraway.15 We also contributed a data set for nopinone, one of the principal products formed in the ozonolysis of -pinene.16 Infrared optical constants for oleic acid and nonanal are currently in progress. Carvone Nopinone Oleic acid Nonanal
Experimental Complex refractive indices are inverted from scattering aerosol extinction spectra, all of which are recorded by a Bomem MB-104 FT-IR spectrometer whose beam passes through the interaction ring of a vertical aerosol flow cell. The cell consists of two sections of 3 inch diameter copper tubing housed in a Plexiglas vacuum jacket. Each section is capable of being in-dependently temperature controlled. The cell top supports up to five injection ports through which aerosol and gas streams may be introduced into the cell. All inflows are regulated by mass flow controllers. Constant cell pressures are maintained by a manifold of needle valves which control cell outflow. All flow cell effluent is removed by a well-trapped mechanical vacuum pump.
A variety of methods are used to produce aerosols. Single-component particles are often generated via homogeneous nucleation in a glass vaporizer. Particle size is controlled in this case by varying vaporizer temperature, flow, and pressure. Glass frit bubblers are also used, especially when multi-component aerosols are required. A schematic of the entire system is shown to the right. Thin-film infrared spectra of organic compounds are also recorded in the laboratory as well as UV-Vis spectra. These spectra are required by the optical constant retrieval process. The retrieval process is initiated by using a non-scattering spectrum to obtain an estimate of the frequency dependence of k. In this diagram, MFC represents a mass flow controller, Vap an aerosol vaporizer source, CM a capacitance manometer, and D a liquid nitrogen cooled MCT detector.
Extend non- scattering spectrum Convert to estimated k spectrum Select aerosol spectrum and guess rg, g, and This estimate is then used in a Kramers-Kronig transformation to obtain corresponding values of n. These data are then used in a Mie scattering calculation for an ensemble of particles whose radii are assumed to be distributed log-normally according to The calculated spectrum is then compared to a scattering aerosol spectrum. The retrieval parameters are varied in a non-linear least-squares procedure until good agreement between the spectra is achieved. Calculate n using KK relationship PRAXIS Apply correction Perform Mie calculation Vary rg,g, and Compare observed and calculated spectra Minimized? No Yes Improved? Retrieved refractive indices
The top right panel shows the infrared optical constants of carvone. The data set represents the average of the inversion of six scattering aerosol spectra recorded at 298 K. The uncertainty in the real component is ±0.009 units while that of the imaginary index is ±0.011 units. Four scattering aerosol spectra were recorded at 280 K and used to determine the complex refractive indices of nopinone which are shown in the bottom right panel. The uncertainties in both components are ±0.007 units.
The top right panel shows the results of a single inversion of a scattering nonanal aerosol. Unlike the carvone and nopinone optical constants, nonanal is relatively featureless below 1500 cm-1. The bottom right panel shows an example of a non-scattering thin-film spectrum of oleic acid (black) and a scattering oleic acid aerosol spectrum (red, offset for clarity). These types of spectra are used as inputs into the optical constant retrieval procedure.
The top right panel shows how the carvone data set was used in a Mie fit of a spectrum that was recorded in our laboratory, but not used in the retrieval procedure. The final fit reported a geometric mean radius of 2.24 m and a geometric mean standard deviation of 1.25. The lower spectrum shows the difference between the calculated and observed spectra. In the bottom right panel, the nopinone optical constants were used in a Mie fit of a nopinone aerosol spectrum at 298 K, a temperature at which there is an appreciable amount of vapor in equilibrium with the particles. The lower difference spectrum shows the vapor component of the observed extinction.
Multi-component aerosols Actual aerosols are more likely to be comprised of a multitude of materials than not, hence it is somewhat important to understand how multi-component particles interact with electromagnetic radiation. The absorption and scattering of light by mixed aerosols will depend heavily on a number of different properties including their composition and mixing state. Intermolecular interactions between particles components may significantly shift absorption bands relative to their positions for corresponding pure compounds. Similarly, sudden density changes within heterogeneous particles, especially those with both liquid and solid phases, may give rise to complex scattering modes. Homogenous Heterogeneous Heterogeneous Multi-phase
Lorentz-Lorenz (LL) One way to describe the optical properties of a multi-component aerosol is to blend pure optical constants together with an appropriate refractive index mixing rule, several of which can be found in the literature including those of Lorentz and Lorenz, Wiener, Arago and Biot, Dale and Gladstone, and Heller.17 The math-ematical forms of these mixing rules are found to the right. Wiener Arago and Biot Variable key n: real component of refractive index : density P: mass fraction : volume fraction i,j; pure substances ij: mixture Dale and Gladstone Heller
We are currently interested in developing mixing rules that can be used to determine the infrared optical properties of multi-component organic aerosols, and decided to see if the Lorentz-Lorenz rule could be applied to mixtures of carvone and nopinone at 285 K. The investigation was started by measuring the temperature depend-ence of n at 589.3 nm (nD) for the pure compounds and four different mixtures with a Bausch and Lomb Abbe refractometer. The data are shown in the top right panel. The validity of Lorentz-Lorenz rule was then checked against interpolated values of nD at 285 K by plotting the left hand side of the LL equation versus the right hand side as shown in the bottom right panel.
In performing the validity check of the Lorentz-Lorenz rule, it was assumed that carvone and nopinone form a nearly ideal solution and hence used a weighted average of the pure compound densities to determine the density of each solution. The good linearity of the previous graph suggests that the assumption was appropriate. The mixing rule was then applied to both carvone and no-pinone to generate n for four hy-pothetical solutions as shown below. (Spectra offset by 0.05 units for clarity.)
The mixed real components were then subjected to an inverse Kramers-Kronig transform to gen-erate corresponding values of k which are shown below. (Spectra again offset by 0.05 units for clarity.)
The calculated optical constants were then used in a Mie scattering calculation to generate model spectra for a particle ensemble with a geometric mean radius of 0.6 m and a geometric mean standard deviation of 1.30. The scattering features of the mixed and pure aerosols do not appear to depend on composition in this case. Composition does however impact the shape and intensity of the absorption features.
The approach used above considered the changes that occur in n upon mixing and how they affect k through the inverse Kramers-Kronig transformation. Since n and k are dependent on each other, it might be interesting to consider a method in which the imaginary components are combined and hence affect n through the forward Kramers-Kronig transform. In this case, we used a mass-weighted rule that is similar to one used by Biermann, et al.18 in their work on binary and ternary solutions of nitric acid, sulfuric acid, and water: where i, j, and P were defined previously. The plot below shows a comparison between the two mixing rules in the carbonyl stretch region for a carvone mass fraction of 0.40. The red k spectrum was obtained via the LL mixing rule while the black spectrum represents the mass weighted average of the pure k spectra.
The panel to the right shows a comparison between calculated Mie spectra for the same composition and particle size distribution used earlier. At first glance, the spectra seem to be identical, yet differences do exist in their more prominent features.
References (1) Jacobson, M.C.; Hansson, H.-C.; Noone, K.J.; Charlson, R.J. Rev. Geophys.2000, 38(2), 267. (2) Rogge, W.F.; Mazurek, M.A.; Hildemann, L.M.; Cass, G.R.; Simoneit, B.R. Atmos. Env.1993, 27A, 1309. (3) Charlson, R.J.; Heitzenberg, J. Aerosol Forcing of Climate; John Wiley & Sons: New York, 1995; pp. 1-10. (4) Albrecht, B.A. Science1989, 245, 1227. (5) Marti, J.J.; Weber, J.R.; McMurry, P.H.; Wisele, F.; Tanner, D.; Jefferson, A. J. Geophys. Res.1997, 102, 6331. (6) Bertie, J.E.; Jones, R.N.; Keefe, C.D. Appl. Spectrosc.1993, 47, 891. (7) Bertie, J.E.; Jones, R.N.; Apelblat, Y. Appl. Spectrosc.1994, 48, 144. (8) Hawranek, J.P.; Jones, R.N. Spectrochim. Acta 1976, 32A, 111. (9) Bertie, J.E.; Jones, R.N.; Apelblat, Y; Keefe, C.D. Appl. Spectrosc.1994, 48, 127. (10) Bertie, J.E.; Zhang, S.L.; Eysel, H.H.; Baluja, S.; Ahmed, M.K. Appl. Spectrosc.1993, 47, 1100. (11) Bertie, J.E.; Lan, Z.; Jones, R.N.; Apelblat, Y. Appl. Spectrosc.1995, 49, 840. (12) Sutherland, R.A.; Khanna, R.K. Aerosol Sci. Technol.1991, 14, 331. (13) Sutherland, R.A.; Khanna, R.K.; Ospina, M.J. Aerosol Sci. Technol.1994, 20, 62. (14) Signorell, R.; Luckhaus, D. J. Phys. Chem. A2002, 106, 4855. (15) Dohm, M.T.; Potscavage, A.M.; Niedziela, R.F. J. Phys. Chem. A2004, 108, 5365. (16) Dohm, M.T.; Niedziela, R.F. Geophys. Res. Lett.2004, 31(14), L14109. (17) Heller, W. J. Phys. Chem.1965, 69(4), 1123. (18) Biermann, U.M.; Luo, B.P.; Peter, Th. J. Phys. Chem. A, 2000, 104, 783. Acknowledgements This work was supported by: Research Corporation Grant CC5399. The College of Liberal Arts and Sciences Summer Faculty Research and Development Grant (RFN), DePaul University. The College of Liberal Arts and Sciences Undergraduate Research Assistantship Program (MKK), DePaul University.