Rationale:
GC21B-0953 Use of MODIS Satellite Data to Evaluate Juniperus spp . Pollen Phenology to Support a Pollen Dispersal Model, PREAM, to Support Public Health Allergy Alerts. Rationale:

Rationale:
E N D
Presentation Transcript
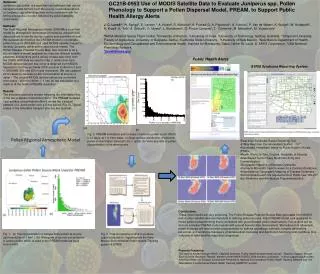
GC21B-0953 Use of MODIS Satellite Data to Evaluate Juniperus spp. Pollen Phenology to Support a Pollen Dispersal Model, PREAM, to Support Public Health Allergy Alerts Rationale: Juniperus spp. pollen is a significant aeroallergen that can be transported 200-600 km from the source. Local observations of Juniperus spp. phenology may not be consistent with the timing and source of pollen collected by pollen sampling instruments. Methods: The Dust REgional Atmospheric Model (DREAM)is a verified model for atmospheric dust transport modeling using MODIS data products to identify source regions and quantities of dust. We successfully modified the DREAM model to incorporate pollen transport (PREAM) and used MODIS satellite images to develop Juniperus ashei pollen input source masks. The Pollen Release Potential Source Map, also referred to as a source mask in model applications, may use different satellite platforms and sensors and a variety of data sets other than the USGS GAP data we used to map J. ashei cover type. MODIS derived percent tree cover is obtained from MODIS Vegetation Continuous Fields (VCF) product (collection 3 and 4, MOD44B, 500 and 250 m grid resolution). We use updated 2010 values to calculate pollen concentration at source (J. ashei ). The original MODIS derived values are converted from native ~250 m to 990m (~ 1 km) for the calculation of a mask to fit the model (PREAM) resolution. Results: The simulation period is chosen following the information that in the last 2 weeks of December 2010. The PREAM modeled near-surface concentrations (Nm-3) shows the transport patterns of J. ashei pollen over a 5 day period (Fig. 2). Typical scales of the simulated transport process are regional. J. C. Luvalla, W. Spriggb, E. Levetinc, A. Hueted, S. Nickovicb, A. Prasadf,G. A. Pejanovicb, A. Vukovicf. P. Van de Waterg, A. Budgeh, W. Hudspethh, H. Krapfli, B. Tothi, A. Zelicoffj, O. Myersh, L. Bundersonc, G. Ponce-Camposb, T. Crimminsl, M. Menacheh, M. Vujadinovicf aNASA Marshall Space Flight Center, bUniversity of Arizona, cUniversity of Tulsa, dUniversity of Technology, Sydney, Australia, eChapman University,fFaculty of Agriculture, University of Belgrade, Serbia, gCalifornia State University, hUniversity of New Mexico, iNewMexico Department of Health, jEpidemiology and Occupational and Environmental Health, Institute for Biosecurity, Salas Center St. Louis & ARES Corporation, lUSA National Phenology Network. *jluvall@nasa.gov Public Health Alerts SYRIS Syndrome Reporting System (a) (b) Fig. 2. PREAM simulation and forecast of airborne pollen count (N/m3) for 2 days, at 1 hr time steps. (a) Near surface distribution of airborne pollen concentration (forecast) for J. ashei, (b) Vertical profile of pollen concentration in the atmosphere. PollenREgional Atmospheric Model • Real-time, Syndrome-Based Reporting Tool • 2-Way Real-time Communication System - 24/7 • Automated, Immediate 'Alerts' to Public Health Officials (PHO's) • Health 'Alerts' to Vets, Doctors, Hospitals, & Schools • Web-Based Tool for Easy Syndrome Entry and Communication • Geographic Mapping of Disease Outbreaks • Connects All Health Care Providers to a Common Database • Instantaneous Geographic Mapping of Disease Outbreaks • Full compliance with the requirements of Public Law 109-417 (the Pandemic and All-Hazards Preparedness Act) b Conclusions: These initial results are very promising. The Pollen Release Potential Source Map generated from MODIS and/or other satellite data are important in defining pollen sources. Initial PREAM model runs appeared to model pollen transport timing that is consistent with ground based pollen observations. Future work will be done to compare PREAM model results with ground based pollen observations. We believe that advanced pollen forecasts will lead to better preparedness for asthma and allergy sufferers, hospital admissions personnel, and workforce managers, pharmaceutical marketing and distribution functions, and contribute to a reduction in false‐positive respiratory diagnoses. Fig. 1. (a) The concentration of Juniper Ashei pollen at source (grid resolution of 1 km2 ). (b) Histogram of source concentration of juniper pollen which is used in the PREAM model as input source field. Fig. 3. Post-processing routine to produce output products for ingesting into the New Mexico Environmental Public Health Tracking system & SYRIS Research Funded by: This work is funded through NASA’s Applied Sciences, Public Health program proposal call: "Decision Support through Earth Science Research Results" element of the NASA ROSES 2008 omnibus solicitation. In-kind support was provided from the Centers for Disease Control and Prevention's National Environmental Public Health Tracking Network and the New Mexico Environmental Public Health Tracking (NMEPHT) system.