Download
1 / 20
200 likes | 360 Vues
The 2008 BFPA conference in Budapest focused on Bulgaria's historical evolution from the Golden Century to EU membership. Established in 1992, BFPA primarily addresses sexual and reproductive health services, targeting underserved youth and professionals. This overview discusses Bulgaria's demographics, including population structure, economic indicators, and education system, particularly in the Dolni Dabnik municipality. It highlights employment sectors, unemployment challenges, and the need for supportive legislation for young people, emphasizing the importance of targeted interventions and economic revitalization.

E N D
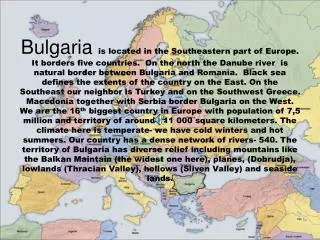
Bulgaria Back to the Future Ventzislav Kirkov, Budapest 19-21 March, 2008
About BFPA • Founded in 1992 • Main areas of the work • Info provision • SRHR services • Target groups • Mainstream YP • Underserved groups • Professionals • Interventions • Campaigns • Mobile services • Static clinics
Historical Background in Dates • 681 • The Golden Century • Knyaz Boris • Tsar Simeon • The Byzantium rule (1018 – 1186) • The Revival of the state under Kaloyan and Ivan-Asen • Bulgaria under the Ottomans • The Rebellion in April 1876 • The war (1877-1878) • The 3rd state • 1885 • The wars • The changes in 1944 • The transition period and EU membership
Population • Total number of the population (2006) – 7 679 290 • Age structure (2006) • Up to 16: 14.6% • 16 – 58.5: 62.8% • Over 58.5: 22.6% • Demographic processes (2006) • Birth rate: 9.2/1000. In the cities: 10.1/1000; in the villages: 8.3/1000 • Natural growth: - 5.1/1000 • Ageing. Average age in the cities: 39.7; in the villages: 45.3 • Life expectancy: 72.6 (males: 69.1, females: 76.3) • Mortality rate: 14.7/1000. In the cities: 12.2/1000; in the villages: 20.7/1000
Main Economics Indicators – Bulgaria 2007 in USD • GDP (Purchasing Power Parity) – 86.73 billions • GDP (official exchange rate) – 39.07 billions • GDP per capita (PPP) – 11 800 • Agriculture: 8.5% (8.5% occupation) • Industry: 31.3% (33.6%) • Services: 60.7% (57.9%) • GDP real growth rate – 6.1% • Unemployment rate: 8% • Inflation rate: 7.8% • Investments: 27.6% of GDP
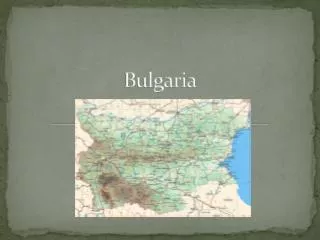
The selected project site – Dolni Dabnik • Municipality of Dolni Dabnik, district of Pleven, North-Central region of Bulgaria • # of towns – 1 (Dolni Dabnik) • # of villages – 6 (Barkach, Gorni Dabnik, Gradina, Krushovica, Peternica, Sadovets)
Education • Municipality schools • High school – 1. Number of students: 246. Staff/students ratio: 1:9.11. Teachers/students ratio: 1:11.18 • Elementary school – 1. Number of students: 246. Staff/students ratio: 1:9.65. Teachers/students ratio: 1:12.95 • Basic schools – 4. Average number of students: 203. Staff/students ratio: 1:7.80. Teachers/students ratio: 1:10.58 • State schools • High school for petrol production. # of students: 157. Staff/students ratio: 1:4.83. Teachers/students ratio: 1:8.72 • High school for agriculture. # of students: 127. Staff/students ratio: 1:4.09. Teachers/students ratio: 1:7.47
Main economical branches • Farming • Agriculture • Stock breeding • Industry • Oil-factory ‘Boatin’ • Workshop for vegetables • Yogurt production • Construction • Commerce and Services
Main branches of employment • Public sector • Extractive Industry • Education (NDP) • Health care (NDP) • Private sector • Farming • Commerce (small entrepreneurs) • Processing Industry
Unemployment: duration and age range • Duration: up to 1 year: 49%. 1-2 years: 26%. More than 2 years: 25% • Unemployment rate: 28% (1999), 32% (2001), 35% (2006) • Up to 24: 16% • 25 – 29: 13% • 30 – 44: 39% • 45 – 49: 14% • Over 50: 18% • Migration: Spain and Greece (appr. 30% of unemployed)
Investment plan of the municipality • Construction of market for farm producers • Restoration of old and planting of new vineyards • Construction of depot for domestic waste • Infrastructure reconstruction
Legislation related to young people • Numerous juridical laws and enactments • A word fit for child, Convention on right of the child, Convention Concerning the Prohibition and Immediate Action for the Elimination of the Worst Forms of Child Laboretc. • National Law for Child protection • Agencies • No economic measures for support of the young people The youngsters in the rural areas are not considered as youth with fewer opportunities. For such are considered children with deaf impairing, blind or with mental disabilities.