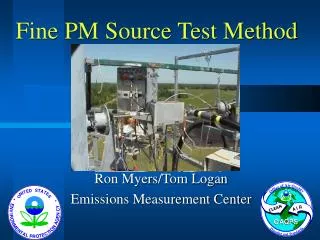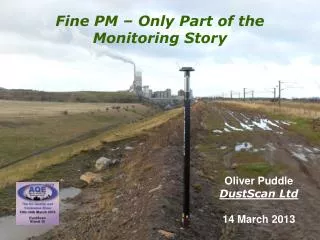
Fine PM Test Method
This presentation by Ron Myers provides an in-depth discussion on various methods for testing fine particulate matter (PM), including the implementation of the National Ambient Air Quality Standards (NAAQS). Key topics include the Condensable PM Test Method, issues surrounding Method 202, and advances in Method 201A. The presentation addresses air quality monitoring strategies, pollution sources, and regulatory updates since 2007, including the implications of the 24-hour PM2.5 NAAQS. Insight is provided into local control needs, the impact of emissions, and participation of various stakeholders in refining air quality standards.

Fine PM Test Method
E N D
Presentation Transcript
Fine PM Test Method Ron Myers OAQPS/SPPD/MPG 9/11/2007
Presentation Topics • Particulate Matter NAAQS • Condensable PM Test Method • Method 202 Issues • Improved CPM Test Method • Expanded Method 201A
8-hour Ozone and Annual PM2.5 NA Areas Designated Nonattainment PM2.5 only* Both 8-hour Ozone and PM2.5* 8-hour Ozone Only OAQPS,AQSSD April 28, 2005 * For PM2.5, the designated partial county areas are shown as actual boundaries designated.
8-hour ozone pollution only Fine particle pollution only 8-hour ozone and fine particle pollution Non Attainment Areas w/ CAIR 2015 with CAIR Projected NAs in 2015 after Reductions from CAIR and Existing CAA programs East 6 ozone 14 PM2.5
Measurement/Monitoring Drivers • PM fines NAAQS • Ambient Air Speciation Data • Implementation Rule • Permits Program • NSR/PSD • Title V • State Programs • Consolidated Emissions Reporting Rule
Promulgated Implementation Rule • April 25, 2007 in Federal Register • Regulation of precursor pollutants • SO2, NOx • VOC, NH4 • RACT/RACM selected to attain NAAQS as expeditiously as practicable • Regulation of Condensable PM • Transition period from 2007 to 2011 • CPM regulation encouraged but not required • Regulations developed after 2011 are required to address CPM • Petitions filed by Advocacy Groups, Industry Groups, State Agencies
Promulgated NAAQS Revision (2006) • Affirms 15 ug/M3 PM2.5 annual average • Establishes 35 ug/M3 PM2.5 24 hr average standard • Increases need for local controls • Short term emissions more important • Start up / shut down • Malfunction impacts • Performance degradation • Becomes air quality driver • Establishes 150 ug/M PM10 24 hr average standard
Potential 24-Hour PM2.5 NAAQS NA’s • Current nonattainment area violates new 24-hr NAAQS [32 areas] • Current nonattainment area meets new 24-hr NAAQS [7 areas] • Sites not in a current • nonattainment area violate the new 24-hr NAAQS (59 sites)
Potential 24-Hour PM2.5 NAAQS NA’s • Current nonattainment area violates new 24-hr NAAQS [32 areas] • Sites not in a current • nonattainment area violate the • new 24-hr NAAQS (59 sites)
Method 202 (12//17/91) • Intent - replicate ambient air emissions • PM is defined by the conditions • Each M202 option creates different mass • N2 purge/Air purge/No purge • Water evaporation temperature • Multiple sulfate mass • Analysis of some components • No Referee Method available in 1990
Method 202 Assessment (2004) • Conducted Laboratory Study • 36 samples • SO2 bubbled through impingers • 300 ppm for 1 & 3 hours • 50 ppm for 6 hours • Nitrogen purge and no purge • Hold times from 1 to 20 hrs for initial analysis
Method 202 Improvement • Air Control Techniques dry impinger modification • Began M202 improvement stakeholder process • Over 100 participants • Environment Canada • Industrial Sources • EPRI, US CAR, API, NEDA/CAP, NCASI, PAPERCAN, PCA, UARG . . . • State Local Agencies • NACAA, NYSERDA, AL, CA, DE, IN, WI, MD, MI, NC, NJ, NY, OR, Indianapolis, Knoxville • Other Organizations • Alston Power, B&W, ICAC, SES
Future Performance Evaluations • EPRI laboratory studies • Higher moisture concentrations • Higher SO2 concentrations • Lower SO2 concentrations • Addition of SO3 • EPA laboratory studies • Addition of Ammonia • Field precision evaluation
Filterable PM Sizing • Method 201A (1990) • CTM40 Method 201A (2008/9)