Integrating Compton DAQ and Analysis
This document outlines the integration of Compton DAQ and analysis efforts, highlighting results from November 2006. It details specifications for a new FADC and its applications, offering insights into data analysis with the integrated system. Key observations include the effectiveness of accumulators, challenges such as electronic noise, and necessary improvements for better signal fidelity. The document also references previous experiences and outlines future expectations for FADC enhancements from selected vendors. Overall, it emphasizes the promising potential of integrated data analysis solutions.

Integrating Compton DAQ and Analysis
E N D
Presentation Transcript
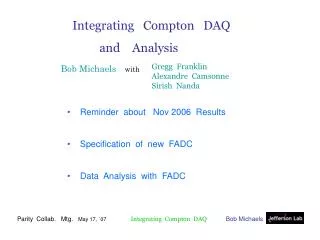
Integrating Compton DAQ and Analysis Gregg Franklin Alexandre Camsonne Sirish Nanda Bob Michaelswith • Reminder about Nov 2006 Results • Specification of new FADC • Data Analysis with FADC
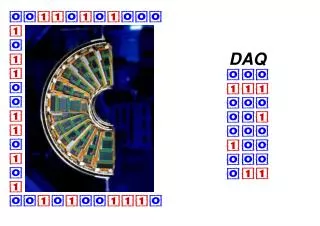
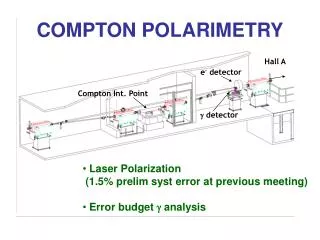
Nov 2006Compton Integration DAQ • FADC Data integrated over helicity pulse (30 msec) • FADC samples also available. • BCM, Compton laser status, & EPICS data available. FADC 2nd floor cnt room amplifier ~ 30 m 1st floor cnt room amplifier Compton photons ~ 20 m detector fanout PMT ~ 120 m to counting DAQ (Neg. HV) Inside Hall A
FADC Samples that look like signal Voltage(full scale ~2 V) Time (ea. bin 5 nsec)
FADC Samples that look like background Voltage(full scale ~2 V) ~ 50 nsec Time (ea. bin 5 nsec)
Integral over the width of individual pulses It’s what the counting DAQ does, too. Clear Compton events seen. LED calibrates energy scale. Brehmstrahlung background (1/E)
To obtain a digital integralwithzero deadtime: use so-called “Accumulator” = sum of samples subject to cut conditions : over 30 msec helicity window • Cut conditions are optional • Sample above a certain threshold. • Sample below another threshold. ( can be turned off ) ( eliminates noise ) ( eliminates background ) Full-sampling mode used to evaluate systematic errors.
Setting up Accumulator (Nov ’06 data) • Problems: • The high cut didn’t work so we made big pulses “clip” at zero. • We did not know the pedestal of accumulator (understood later). FADC sample (ADC units)
Asymmtries from Accumulator and different thresholds ! Day 1 : IHWP out Day 2 : IHWP in FLIP laser pol. Laser off.
Summary of Nov `06 Experience • Saw Compton events, good signal-to-background • Too much electronic noise • Accumulators worked well, but ... • Need shorter cable runs. • Want no amplifiers • Get more gain with 12-stage PMT ? • Asymmetries made no sense until we realized … • Pedestal subtraction wrong and threshold dependent. • Need more info. to subtract pedestals.
Specification of new FADC with fancier accumulators by Bob Michaels and Gregg Franklin http://www.jlab.org/~rom/fadcspec.pdf • Spec has been sent to two vendors: SISGmbH and CAEN. • Expect boards from each vendor in ~August. • Old SISGmbH boards can be updated (new firmware) • Boards have other uses in Hall A.
Custom FADC based on SIS3320 / CAEN1720. CAEN SIS bipolar Samples ( 33 msec ) See next slides
How Thresholds Work Time Typical Small Pulse Typical Big Pulse (Compton event) (background) Zero Volts Voltage Low Threshold High Threshold
Accumulator Feature See the spec for details. • Samples added between Tstart andTstop • Subject to cut conditions (optional). Ex #1 Data above a threshold, or data between a low & high threshold. Ex #2 Data “N” pulses before & after a threshold (more linear response). • Number of samples available N sample Necessary for pedestal subtraction
Example : How to Analyze Data thanks, Gregg ! FADC measurements Voltage ; Pedestal ; ADC value Conversion ; Integrated Signal ( C cancels in Asy. ) missing in Nov ‘06 Deadtime Correction ( high threshold ``robs’’ signal ) Physical Signal to use in Asymmetry. empirical correction B = background
Conclusions – Integrating Compton DAQ • ``Data Analysis on a Chip” looks promising, may have widespread applications • but yet to be proven. • FADC with new accumulators ready this summer. ~ August