Relationship Between PM2.5 and PM10
50 likes | 356 Vues
Relationship Between PM2.5 and PM10. Background and Rationale PM10-PM2.5 Relationship over the Northeast and Southern California PM10-PM2.5 Relationship over the US Resource Links. Contact: Rudolf Husar, rhusar@mecf.wustl.edu. Background and Rationale.

Relationship Between PM2.5 and PM10
E N D
Presentation Transcript
Relationship Between PM2.5 and PM10 Background and Rationale PM10-PM2.5 Relationship over the Northeast and Southern California PM10-PM2.5 Relationship over the US Resource Links Contact: Rudolf Husar, rhusar@mecf.wustl.edu
Background and Rationale • The PM2.5 NAAQS were introduced in 1997 and a new PM2.5 monitoring network is being implemented. • The existing PM2.5 network is sparse and it is difficult to establish even the gross features of PM2.5 concentrations over the US. • In many areas of the country, PM10 and PM2.5 are related since most of the PM10 is contributed by PM2.5 • Hence, it is useful to evaluate the PM10-PM2.5 relationship. • Evaluating the PM10-PM2.5 relationships provides information on PM2.5 concentrations in areas not monitored for PM2.5.
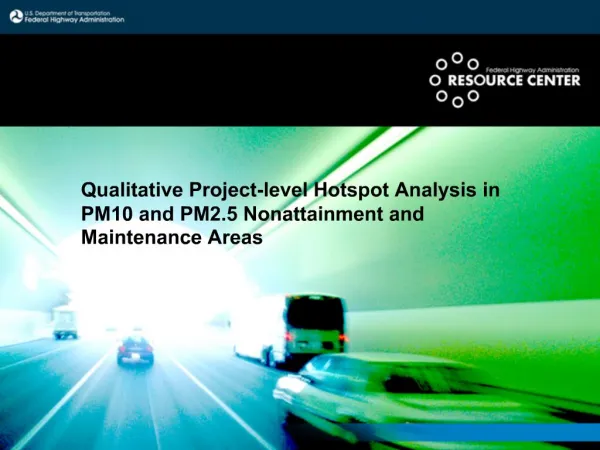
PM10-PM2.5 Relationship over the Northeast and Southern California • PM2.5 compromises a larger fraction and has a more similar seasonal pattern in the N.E. than in Southern California.
PM10-PM2.5 Relationship over the US • Regional average PM10 concentrations range between 28 and 53 g/m3, and the PM10/PM2.5 ratio ranges between 0.37 in the Southwest to 0.62 in the Northeast. However, both the concentrations and the ratio vary considerable within regions.
Resource Links • Workbook Table of Contents • Comment and Feedback Page • Applications / Reports • Data sets used in the Applications • Methods and tools used in the Applications